Grafana Dashboard for OPNSense and Sensei
Grafana Dashboard for OPNsense and the Plugin Sensei
Requirement
- ELK stack 7+
- Telegraf configuration for OPNsense
- Grafana and InfluxDB
Grafana Plugins
- magnesium-wordcloud-panel
- flant-statusmap-panel
- grafana-piechart-panel
- grafana-worldmap-panel
- grafana-sankey-panel (https://github.com/kumaravel29/grafana-sankey-panel)
OPNsense configuration
- ELK logs, configure the ELK logs by following this : https://github.com/3ilson/pfelk
- Install Telegraf plugin and configure it to send metrics into InfluxDB
Grafana configuration
- Configure the Datasource for InfluxDB
-
Configuration of the pfelk Elasticsearch Datasources :
            Name : Elasticsearch-Firewall
            URL : yourELKIP:9200
            Index name : pfelk-firewall*
            Time field name : @timestamp
            Version : 7.0+

            Name : Elasticsearch-Suricata
            URL : yourELKIP:9200
            Index name : pfelk-suricata*
            Time field name : @timestamp
            Version : 7.0+

            Name : Elasticsearch-unbound
            URL : yourELKIP:9200
            Index name : pfelk-unbound*
            Time field name : @timestamp
            Version : 7.0+

            You can use the Name you want and filter it in the dashboard your import, in the Settings -> Variables -> Elasticsearch
            -> Adn modify the "Instance name filter" for exemple here for matching suricata : /.*Suricata.*/
Dashboard OPNSense :
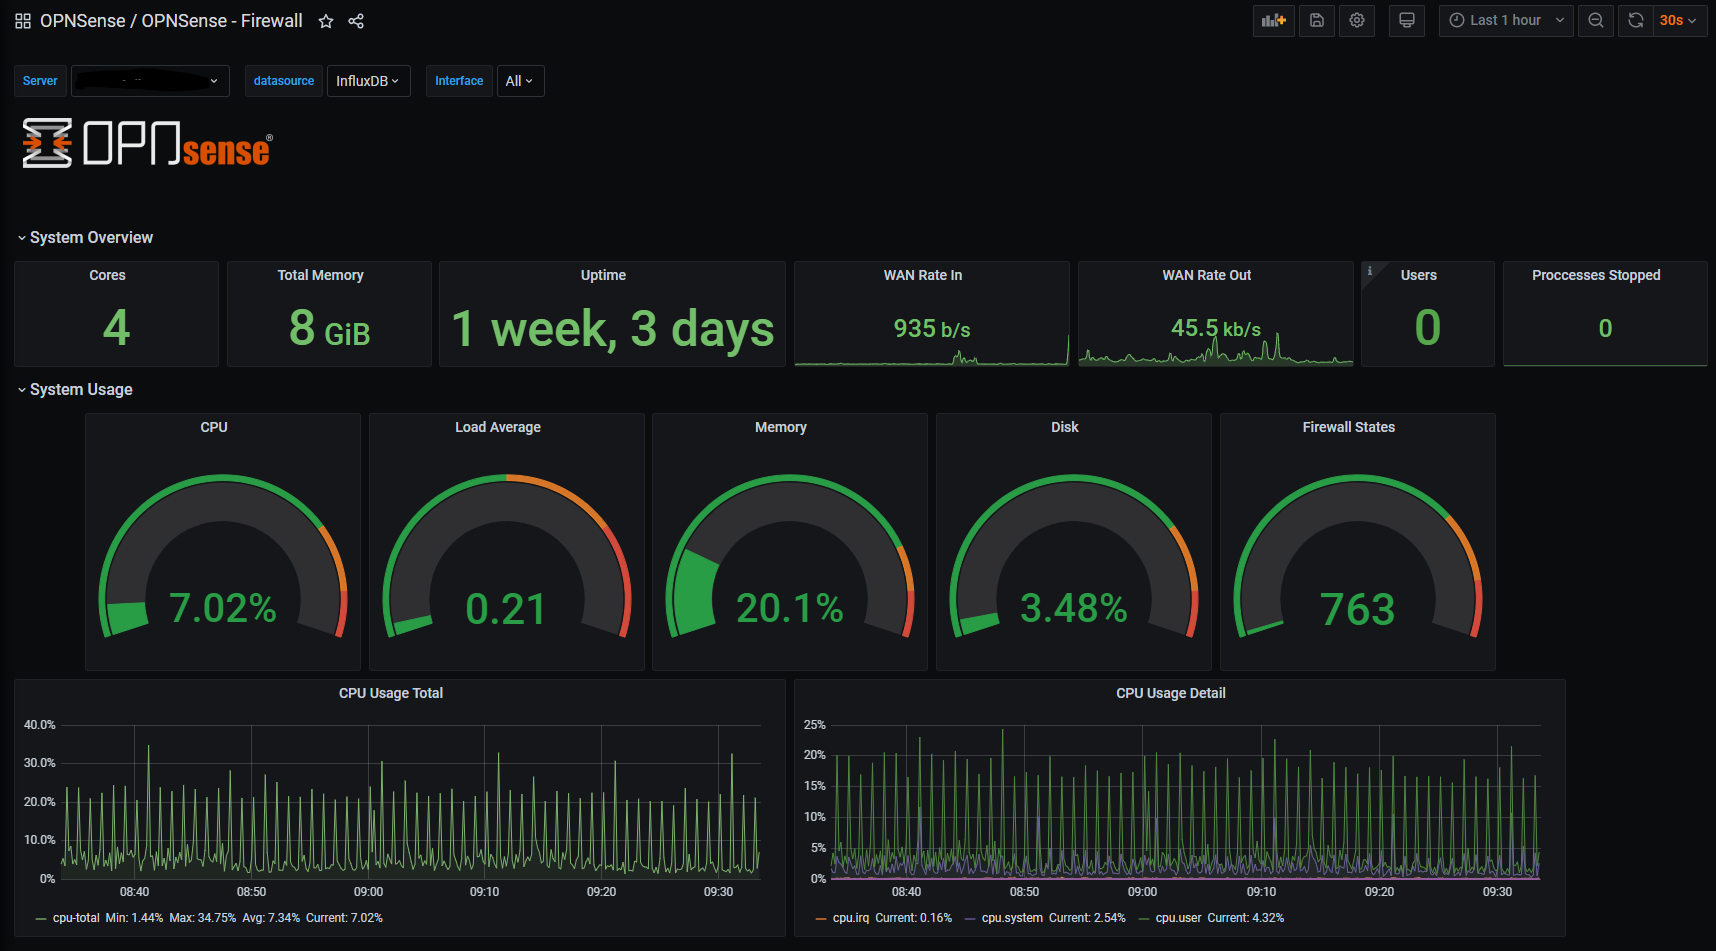
InfluxDB : OPNSense - Firewall
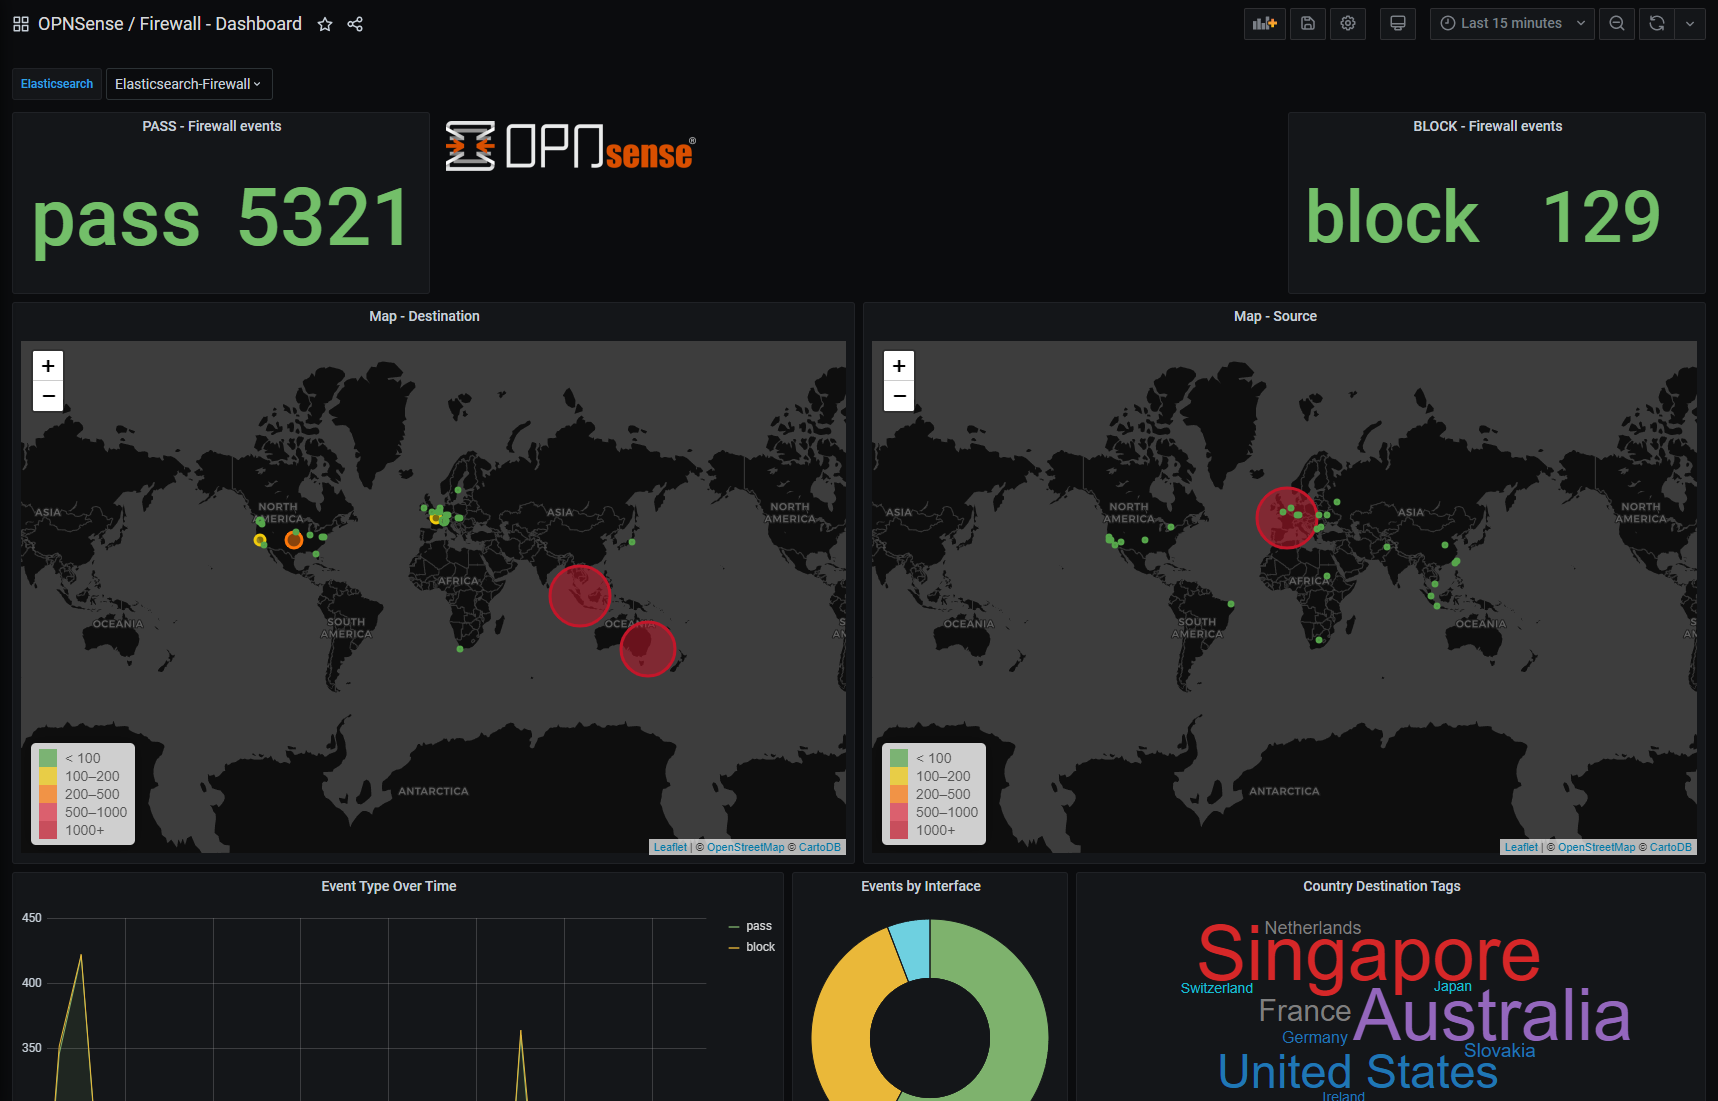
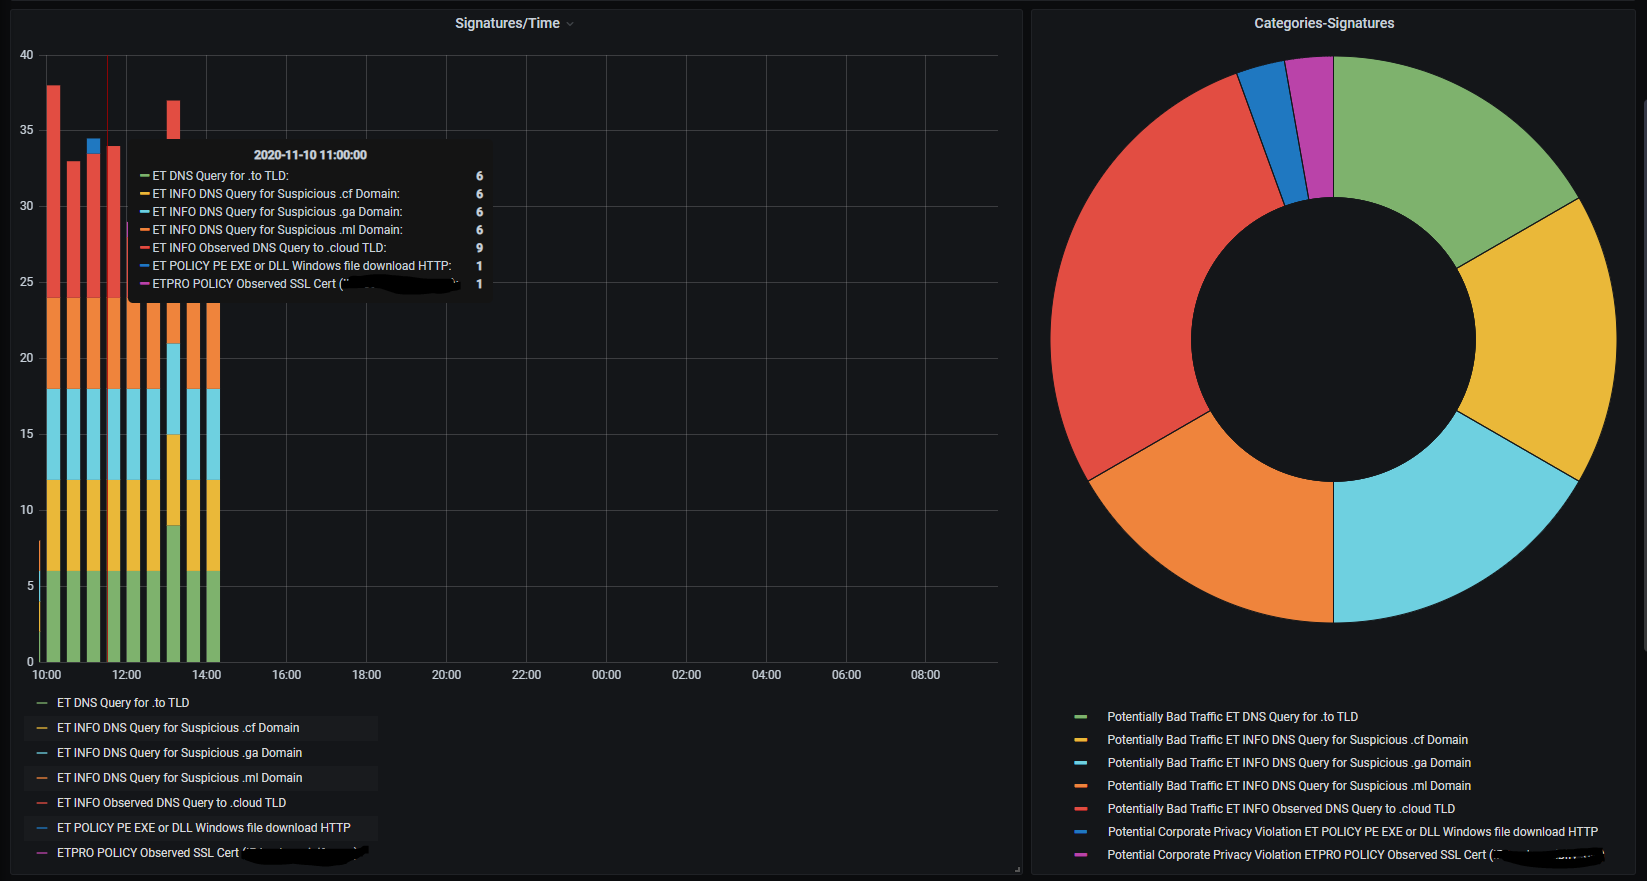
ELK : Firewall - Dashboard | Firewall - Suricata | Firewall - UnboundConfiguration for Sensei Module https://docs.opnsense.org/vendor/sunnyvalley/sensei.html
Configure Sensei by using external ELK (like the one you have previously install) Or you can use the internal ELK who is install during the Sensei installation. Just configure a Port translation from your administration interface or OPNsense on the port 9200 to the 127.0.0.1:9200
- Configuration of the pfelk Elasticsearch Datasources : Name : Elasticsearch-Sensei URL : yourELKIP:9200 Index name : * Time field name : start_time Version : 7.0+ Or 5.6+(for Internal OPNsense Sensei ELK)
Grafana dashboard on grafana.com
- OPNSense_Firewall : https://grafana.com/grafana/dashboards/13386
- OPNSense Firewall Dashboard : https://grafana.com/grafana/dashboards/13383
- OPNSense Firewall Suricata : https://grafana.com/grafana/dashboards/13384
- OPNSense Firewall Unbound : https://grafana.com/grafana/dashboards/13385
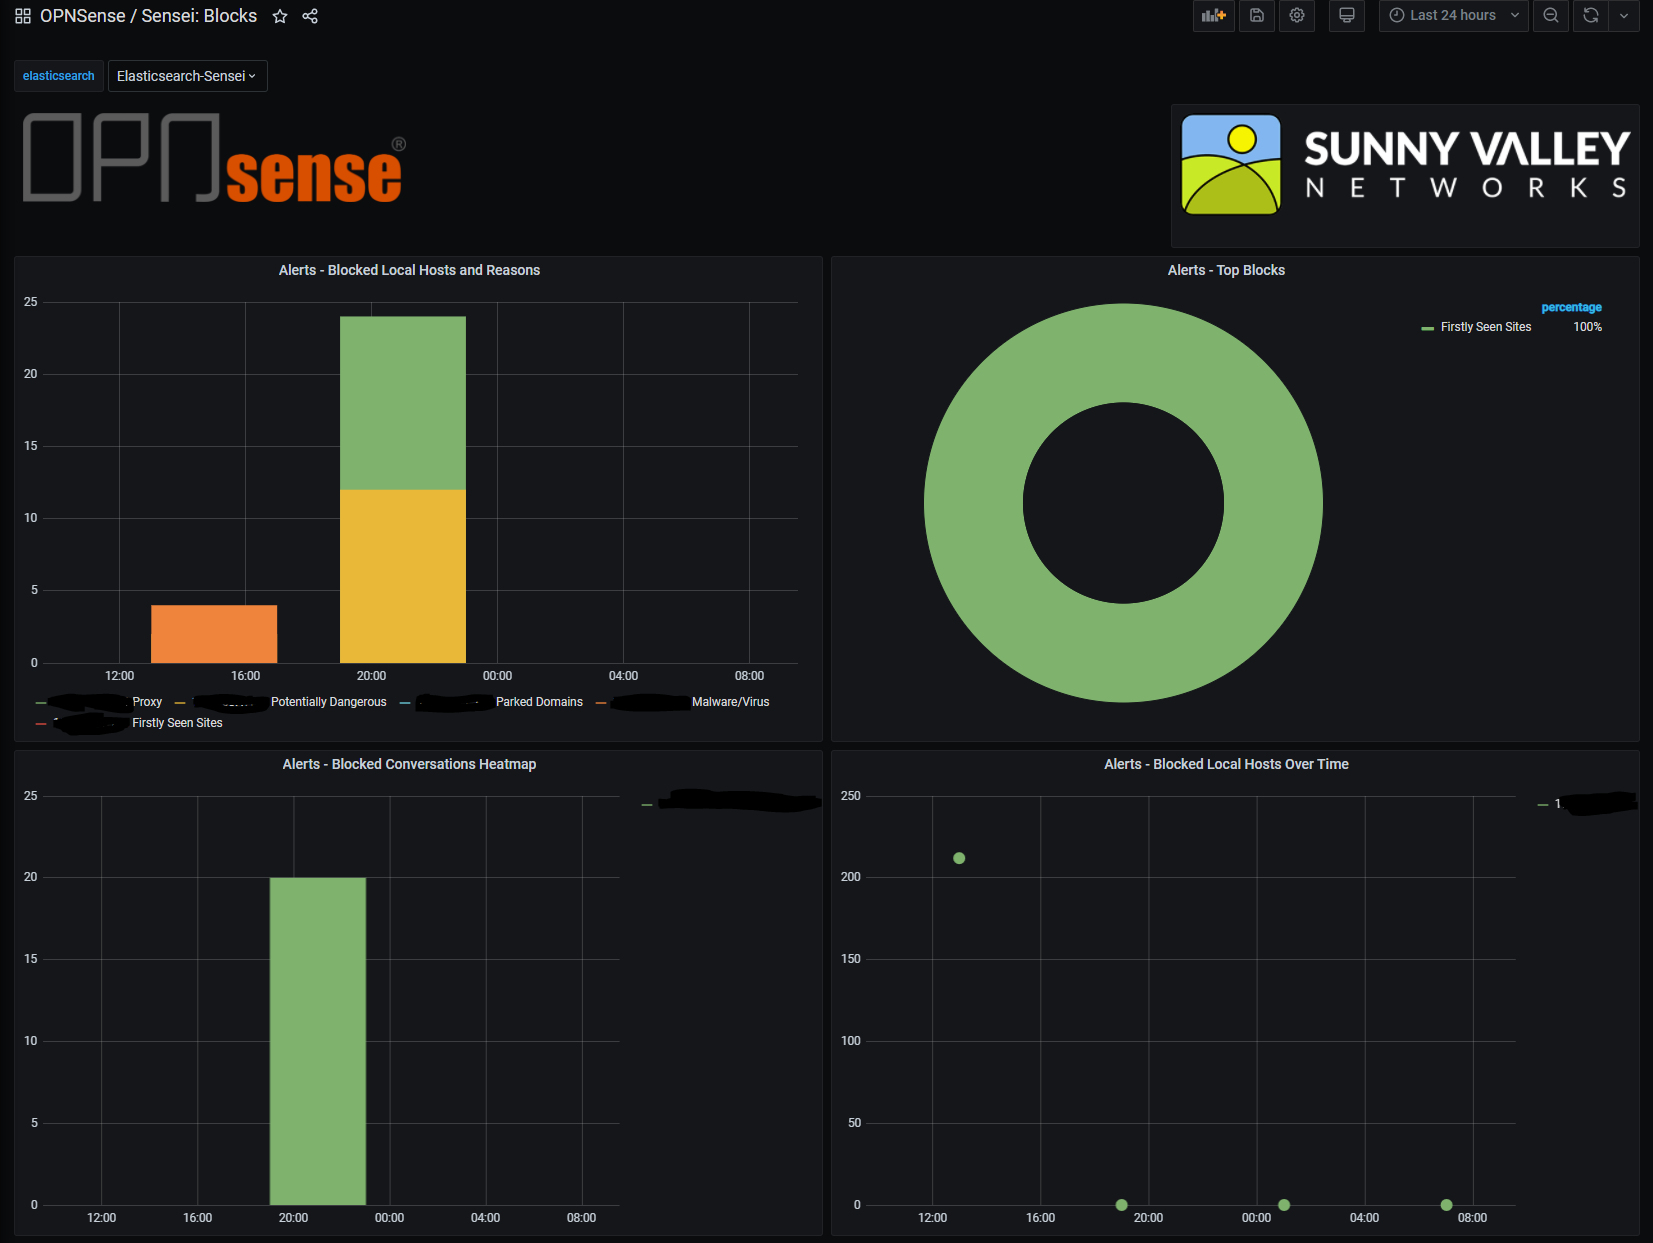
- OPNSense Sensei Block : https://grafana.com/grafana/dashboards/13387
- OPNSense Sensei DNS : https://grafana.com/grafana/dashboards/13388
- OPNSense Sensei Reports : https://grafana.com/grafana/dashboards/13390
- OPNSense Sensei Threats : https://grafana.com/grafana/dashboards/13391
- OPNSense Sensei Web : https://grafana.com/grafana/dashboards/13392
OPNSense Firewall
OPNSense Firewall Dashboard
OPNSense Firewall Suricata
OPNSense Firewall Unbound

OPNSense Sensei Block
OPNSense Sensei DNS

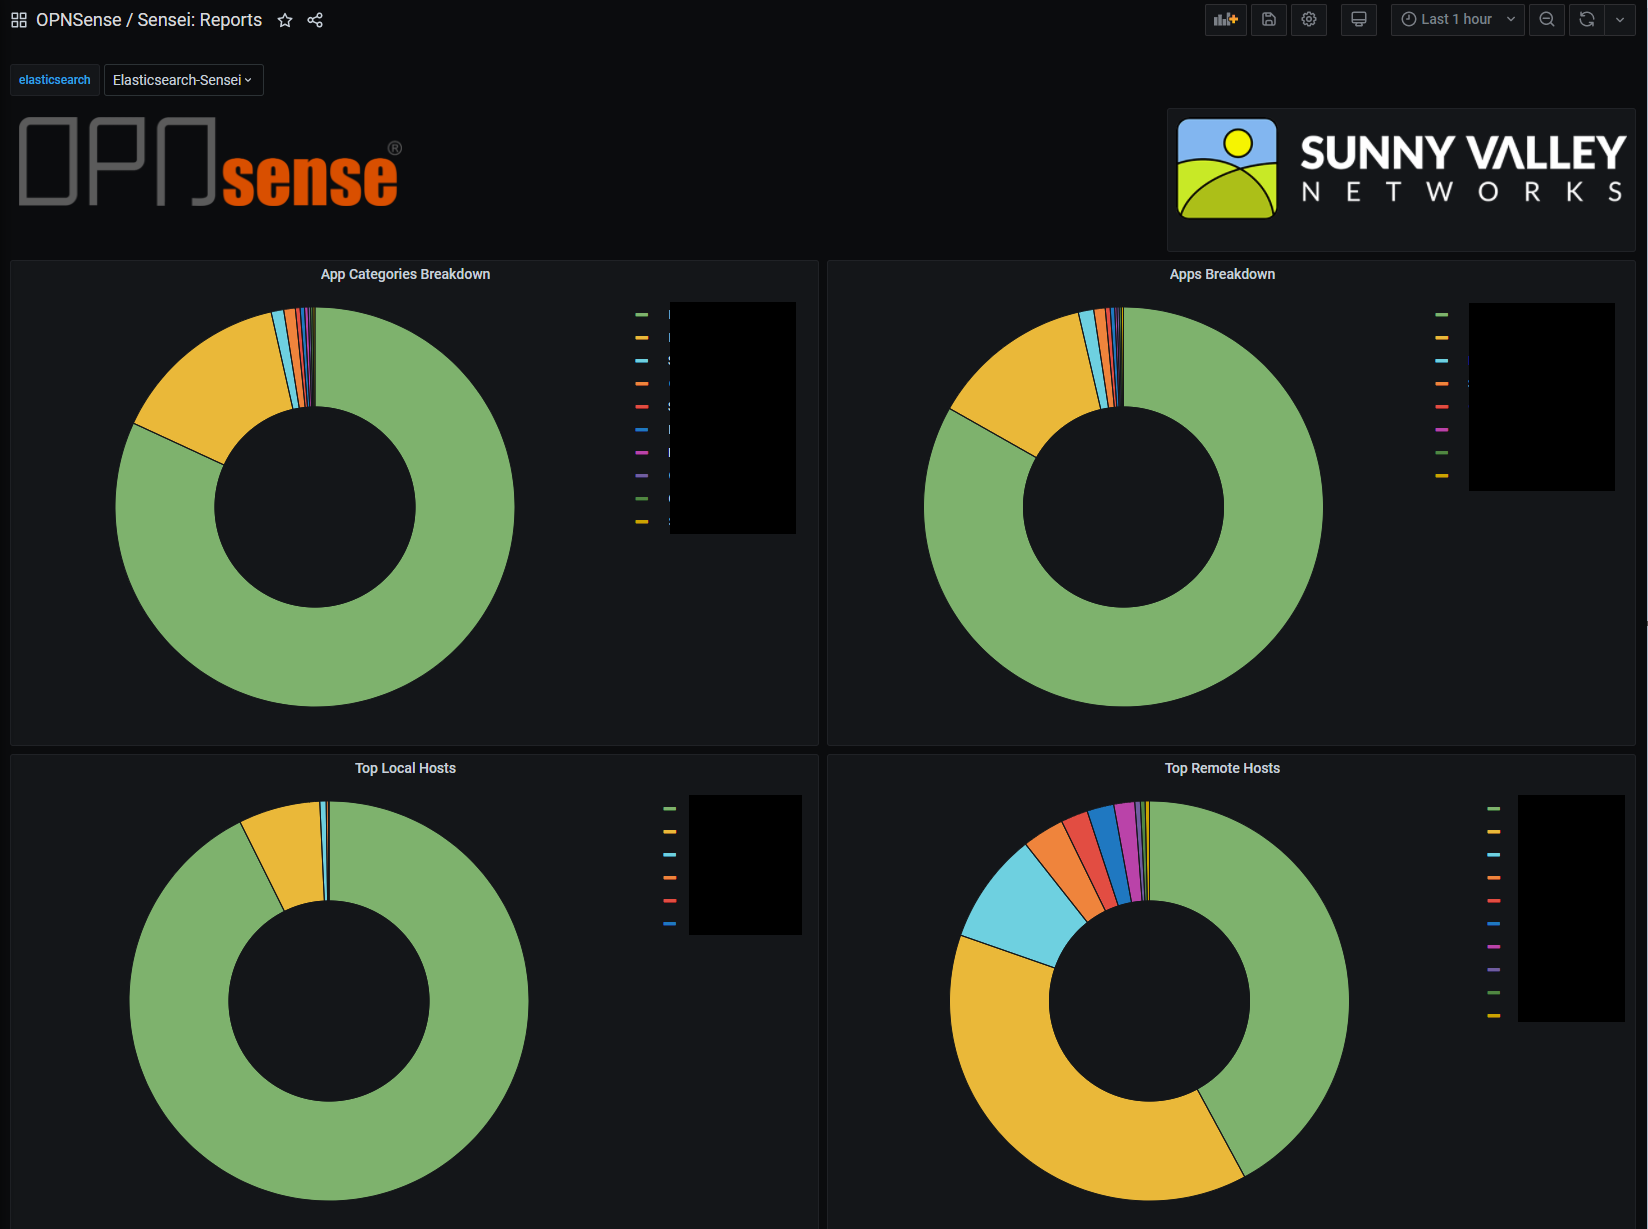
OPNSense Sensei Reports
OPNSense Sensei Threats

OPNSense Sensei Web

Link : https://opnsense.org/ OPNsense is an OSS project © Deciso B.V. 2015-2020 - All rights reserved https://www.sunnyvalley.io/sensei/ Sunny Valley Networks name and logo are trademarks of Sunny Valley Cyber Security Inc. All other brand names, product names, or trademarks belong to their respective owners.