 xiazen
commented
6 years ago
xiazen
commented
6 years ago that seems odd. do you have memory dump from the server? if logs cannot give us anything with good insight, maybe memory dump will, because this looks like something slowly grow bad in the server.
Or do you monitor the memory and cpu use on the server? that might be an easier starting point than memory dump
 SebastianStehle
 DarkCow
 stephenlautier


 SebFerraro
 sergeybykov
 ReubenBond
 lfzm
lfzm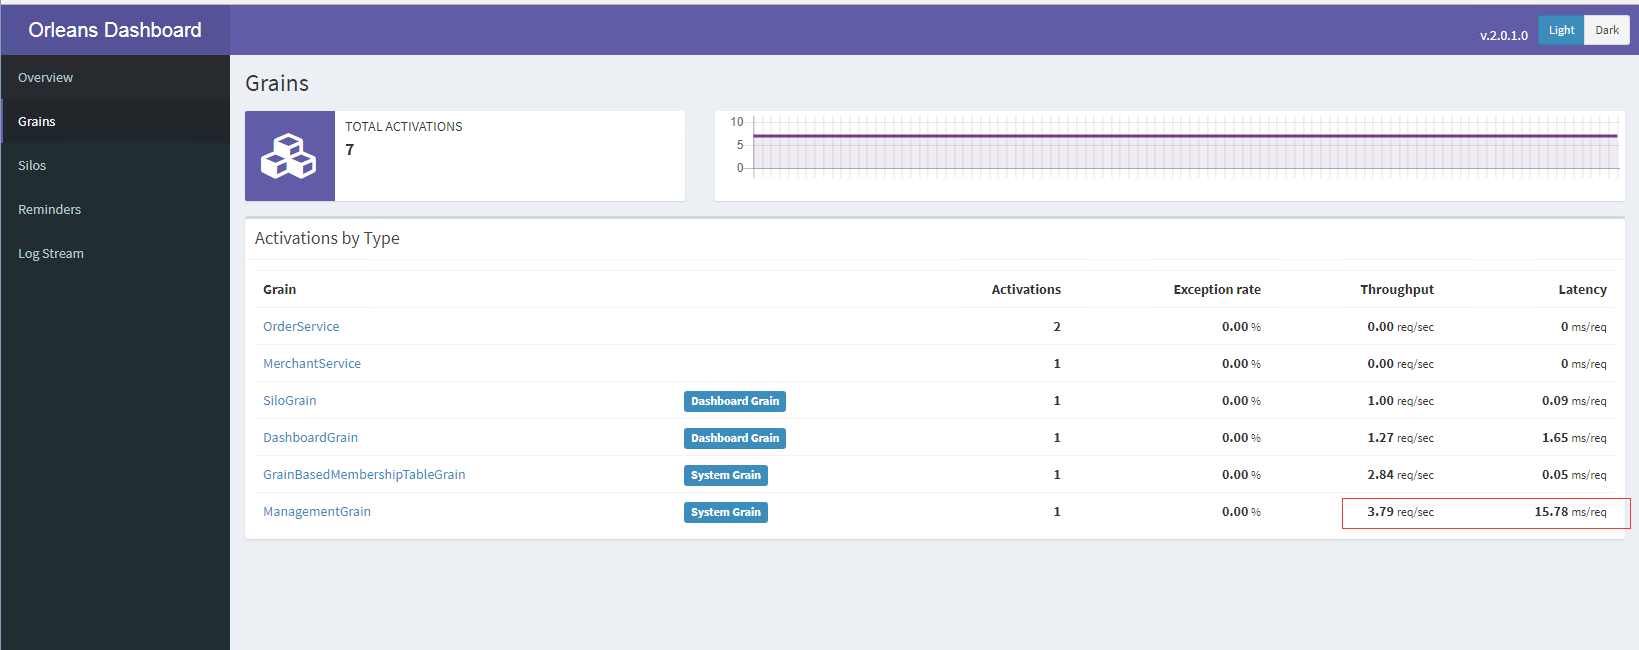
 richorama


 jonathansant
 guysegal
 Gabrn
Gabrn
 lwansbrough
 ilyalukyanov
 shlomiw
 mohamedhammad
Hi,
it is a little bit vague, but I have the impression that Orleans gets slower over time.
My specs are:
I have a very simple grain, that just returns the snapshot (my own state system):
https://github.com/Squidex/squidex/blob/master/src/Squidex.Domain.Apps.Entities/Schemas/SchemaGrain.cs#L305
I use my own serializer with JSON.NET and my benchmarks show that the serialization takes 2-3 ms usually. I also tested it with 100x larger states that expected and the performance is great.
I added some profiling to the client side and I have experienced that the call takes 4-5 ms after I deploy it and several days later up to 200ms or even more (the max I have seen is 10seconds).
I also checked my MongoDB logs where I save all slow queries and there is nothing related.
I am a little bit lost.