 jrgp
commented
3 years ago
jrgp
commented
3 years ago You're totally right about the CPU core density. On the newer version of the machine in the screenshot you posted (Machina), it now has 32 threads up from 4. I'm not sure of a better way of displaying this information, as we show the unique speed of each thread.

You mentioned showing a graph of speeds over time with one line per thread with the graph's X axis. This is problematic as we can't rely on speed values for past page loads.
It is possible, however, to feed data (such as cpu speeds) from Linfo's JSON REST API into graphing/metrics solutions such as Grafana/Influx to get pretty graphs.
 Saentist
Currently each tread report CPU name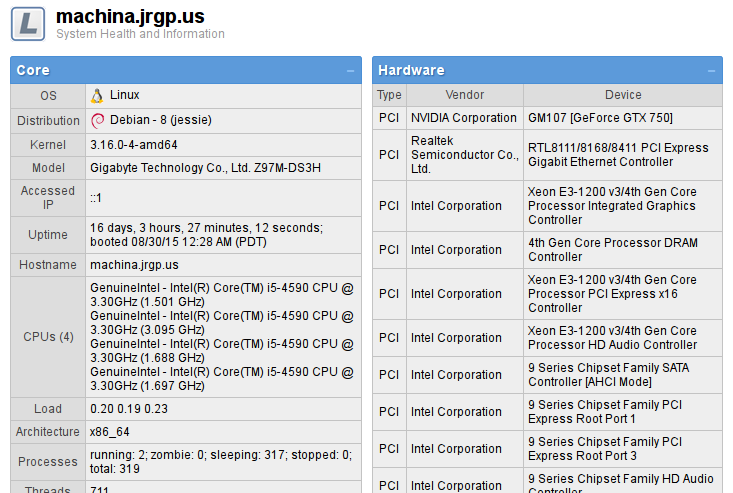 imagine how many space take 2x of latest 64 core EPYC cpu's (256 lines )
Each page refresh show current core speed Is it possible to add some chart graph as https://canvasjs.com/php-charts/dynamic-live-multi-series-chart/