marcomusy / vedo

A python module for scientific analysis of 3D data based on VTK and Numpy
https://vedo.embl.es
MIT License
2.06k stars 267 forks source link

Scale bar #260

Open FedeClaudi opened 3 years ago

FedeClaudi commented 3 years ago

Hi Marco,

itkwidgets has a very nice scale bar functionality (see screenshot below, the number changes depending on how zoomed in you are), is there something similar in vedo? I know that there's an axis option that shows a ruler at the bottom of the screen, but I could never quite figure out if it would work as a scale bar. Also in general I'd prefer something small like in the the screenshot.

image

I guess it would be possible to hack something like this using a 2d scale bar, but was wandering if you had already something set up for it.

To be clear: what I'd like is something that maps the length of a line in number of pixels in the window to what that corresponds to in the scene in terms of distance between two points. So I don't want a ruler that just shows the distance between two points. Say that the scalebar line is 100px long, if I'm very zoomed out that could be equal to a distance of 1000 between two points, but once I zoom in a lot the same line shows the distance betwee two points that are say 50 apart, makes sense?

marcomusy commented 3 years ago

Hi Federico, it makes sense! Except that one should keep in mind that such an indicator is meaningful only in parallel projection mode (not in perspective mode) . Indeed axes=13 should be disabled in perspective:

from vedo import *
c = Cylinder()
x0,x1,y0,y1,z0,z1 = c.bounds()
r = Ruler([x1+.1,y0,z0], [x1+.1,y1,z0], units='\mum')
show(c, r, axes=13) # 13=vtkLegendScaleActor
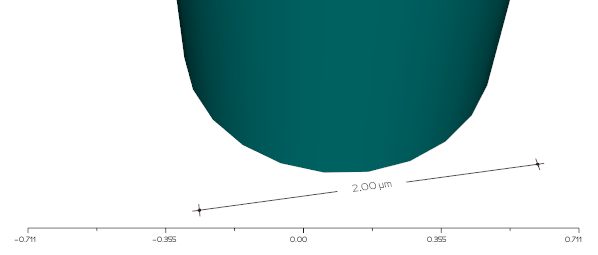
bb

parallel: pp

I'll see if I can customize the https://vtk.org/doc/nightly/html/classvtkLegendScaleActor.html to make it similar to the itkwidget style.

FedeClaudi commented 3 years ago

Hey,

That makes a lot of sense, thanks. How can one switch between modes?

marcomusy commented 3 years ago

Use settings.useParallelProjection=True

marcomusy commented 3 years ago

I guess this is what you mean... (right-click and drag to see it changing).. but I only went this far in implementing it..


import vtk
from vedo import *
settings.useParallelProjection=True
plt = Cube().alpha(0.2).show(axes=dict(xtitle='x (mm)'), interactive=0)

def scale_indicator():
    s = 0.02
    pos = (0.7,0.1)
    length = 2
    units = 1

    ppoints = vtk.vtkPoints()  # Generate the polyline
    psqr = [[0.0,0.04],[length/10,0.04]]
    dd = psqr[1][0] - psqr[0][0]
    for i, pt in enumerate(psqr):
            ppoints.InsertPoint(i, pt[0], pt[1], 0)
    lines = vtk.vtkCellArray()
    lines.InsertNextCell(len(psqr))
    for i in range(len(psqr)):
        lines.InsertCellPoint(i)
    pd = vtk.vtkPolyData()
    pd.SetPoints(ppoints)
    pd.SetLines(lines)

    rlabel = vtk.vtkVectorText()
    rlabel.SetText('test')
    tf = vtk.vtkTransformPolyDataFilter()
    tf.SetInputConnection(rlabel.GetOutputPort())
    t = vtk.vtkTransform()
    t.Scale(s,s,s)
    tf.SetTransform(t)

    app = vtk.vtkAppendPolyData()
    app.AddInputConnection(tf.GetOutputPort())
    app.AddInputData(pd)

    mapper = vtk.vtkPolyDataMapper2D()
    mapper.SetInputConnection(app.GetOutputPort())
    cs = vtk.vtkCoordinate()
    cs.SetCoordinateSystem(3)
    mapper.SetTransformCoordinate(cs)

    fractor = vtk.vtkActor2D()
    csys = fractor.GetPositionCoordinate()
    csys.SetCoordinateSystem(3)
    fractor.SetPosition(pos)
    fractor.SetMapper(mapper)
    fractor.GetProperty().SetColor(0,0,0)
    fractor.GetProperty().SetOpacity(1)
    #fractor.GetProperty().SetLineWidth(2)
    fractor.GetProperty().SetDisplayLocationToForeground()

    plt.renderer.AddActor(fractor)
    def func(iren, ev):
        wsx, wsy = plt.window.GetSize()
        ps = plt.camera.GetParallelScale()
        newtxt = utils.precision(ps*units/wsy*wsx*length*dd,3)+' mm'
        rlabel.SetText(newtxt)
        #t.Scale(.1,1,1)
        plt.interactor.Render()

    plt.interactor.AddObserver('InteractionEvent', func)
    plt.interactor.Render()
    return fractor

scale_indicator()

interactive()

image

there are a number of issues which seem difficult to solve. I'll keep this open in case i come up with a reasonable solution..

FedeClaudi commented 3 years ago

Hey,

thanks for giving it a shot. That looks like it's exactly what I had in mind, what are the issues?

marcomusy commented 3 years ago

what are the issues?

many :)

marcomusy commented 2 years ago

Only after 2 years... there it is :)


from vedo import settings, Cube, Plotter
settings.useParallelProjection = True
cube = Cube().alpha(0.2)
plt = Plotter(size=(900,600), axes=dict(xtitle='x (um)'))
plt.addScaleIndicator(units='um', c='b4')
plt.show(cube, "Scale indicator with units")

Screenshot from 2022-01-12 17-52-39