It works. It's wonderful!
Two questions for @xuanxu (maybe I should open new issues):
- To complete all the information we need for the post-processing we'd need to add to the json a list of front pages that are not available AND the size of the front page, is that easy to add?
It's crucial to be able to calculate the percentage of area in available newspapers in one frotn page and in any given particular.
The result would be something similar to this:
{"areas":
 [
  {"areas_id":106,"user_name":"numeroteca", ... ,"area_height":88},
  {"areas_id":107,"user_name":"numeroteca",...,"area_height":190}
 ],
"no_image":
 [
  {"publication_date":"2016-10-04","media_name":"Clarín","media_country":"Argentina"},
  {"publication_date":"2016-10-06","media_name":"Crónica","media_country":"Argentina"}
 ],
"image_size":
 [
  {"media_name":"Clarín","media_country":"Argentina","width":750;"heigh":1041},
  {"media_name":"Clónica","media_country":"Argentina","width":750;"heigh":1041}
 ]
}
We should assume all the days have the same size for a particular media.
- Now that I use it, it would be very useful to allow re-coding. That means, clicking in an area and re-assign it to another "code" or change one of the "taxonomies". How complicated would be that?


TLDR: This new feature would add the capability to add extra information to drawn areas. A highlighted area could have multiple taxonomies and open fields.
This feature was requested time ago (see thread in the emails list by Ariadna and #82).
A drawn area is now related to a unique topic. An area is defined by its dimensions, location in the front page, user that created it, newspaper, date and topic.
We want to associate it to other taxonomies like "frame:positive" (or "frame:negative" or "frame:neutral") or "corruption_type:administration".
Basic version
This version would have predefined taxonomies when enabling this "Extra fields" feature.
Update/create thread
When editing/creating a thread there would be a section "advanced features" that can be enabled. Once enabled (check box marked) the user would be able to classify the areas by these extra taxonomies while coding (drawing areas).
To start (and test) we can create a taxonomy called "frame". With the predefined options:
The taxonomy terms for these new taxonomies would be editable by the administrator of PageOneX in a special page, accessible through the menu under the Admin section.
Drawing areas
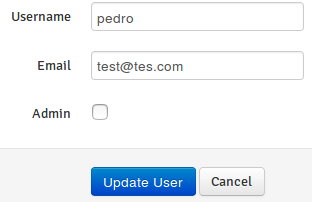
When editing an area it will be displayed in a secondary dropdown menu (see image): You can select the category and then the frame.
Export
RAW (all areas dRAWn)
Add new way of exporting data in json (or csv, whichever is easier) that we will call "raw", includes all the highlighted areas. I think a flat object in csv would be easier to handle.
In the exported file all the information associated with an area should be included:
I am thinking in post-processing this file with R.
To complete all the information we need for the post-processing is a file with all the front pages that are not available. I am thinking how this should be. Working on it.
Display
For the moment this feature will no affect the display.
Enhanced version
In a future enhancement the user would be able to create such new fields/taxonomies on the fly when creating/editing a thread.
It will be possible to juxtapose the different taxonomies used in a single visualization (following this example http://numeroteca.org/2013/02/06/3-steps-to-measure-the-corruption-coverage-in-spain/ or this one http://numeroteca.org/2016/06/12/dieta-mediatica-en-precampana-26j/) and calculate.
Export
ODS
In the spreadsheet every tab belongs to one newspaper. Example for the data in tab for "The Guardian" newspaper, current status:
The value is the percentage of area dedicated to a particular topic in one front page in one newspaper a particular day (date is written in numeric format).
After adding extra field we need to create extra columns:
Adding one extra taxonomy would make the spreadsheet very complicated, which makes me think that we will need an extra feature to export all the areas.
JSON
The main JSON structure that has all the data structured as follows: Date > Newspaper > Topic:Percentage
Work in progress.
Date > Newspaper > Area id > {Area:Percentage, Position:(x,y center coordinates in %),Topic:topic1, Frame:frame1}