 dwinston
commented
9 years ago
dwinston
commented
9 years ago Some of them are broken. :(
Open nmashouf opened 9 years ago
dwinston
commented
9 years ago Some of them are broken. :(
 nmashouf
commented
9 years ago
nmashouf
commented
9 years ago Try these: All Data https://plot.ly/~nmashouf/3 Volume https://plot.ly/~nmashouf/8 Delta Volume https://plot.ly/~nmashouf/20 Density https://plot.ly/~nmashouf/11 EFermi https://plot.ly/~nmashouf/5 Final Energy https://plot.ly/~nmashouf/14
dwinston
commented
9 years ago Wow, I wouldn't have thought of plotting vs fermi energy. Cool, thanks for sharing!
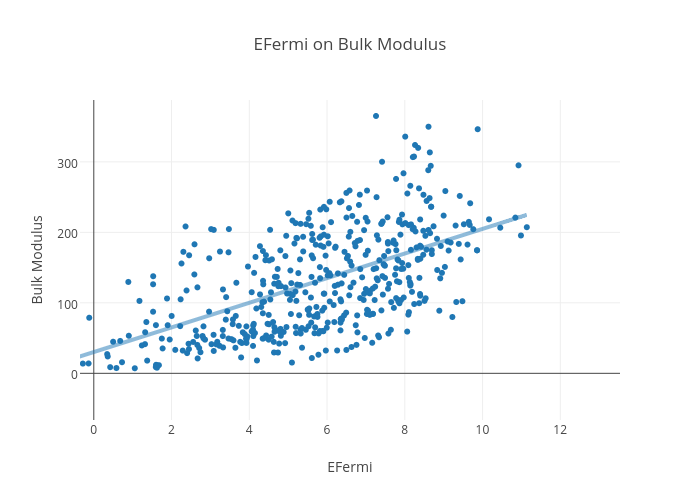
In search of relevant parameters for our elasticity-computation-guiding algorithm, I plotted pymatgen bulk modulus data ('elasticity.K_VRH') against various material properties data and found a few interesting correlations (mostly Volume, Density, and EFermi). These graphs each only include 500 data points, so we can look into more sophisticated methods if the trends seem legitimate! (apologies for the lack of units on the graphs, but the data is pure pymatgen data so they are all in the same units as the material property defines in the documentation)
Here are the links: All data https://plot.ly/~nmashouf/3?share_key=TnCSEyPBO9kYM3TRRbNQOy Volume https://plot.ly/~nmashouf/8?share_key=ImVUfLjl7xKh011Tp7lttp Delta Volume https://plot.ly/~nmashouf/20?share_key=jIVgwLAML5lvi3snE0RLZv Density https://plot.ly/~nmashouf/11?share_key=3gpUcsGo7219kMevEy4iza EFermi https://plot.ly/~nmashouf/5?share_key=CGrha5FuZmteP25jx13PJh Final Energy https://plot.ly/~nmashouf/14?share_key=4PDyNIffu2zLiN3GTkkiOv