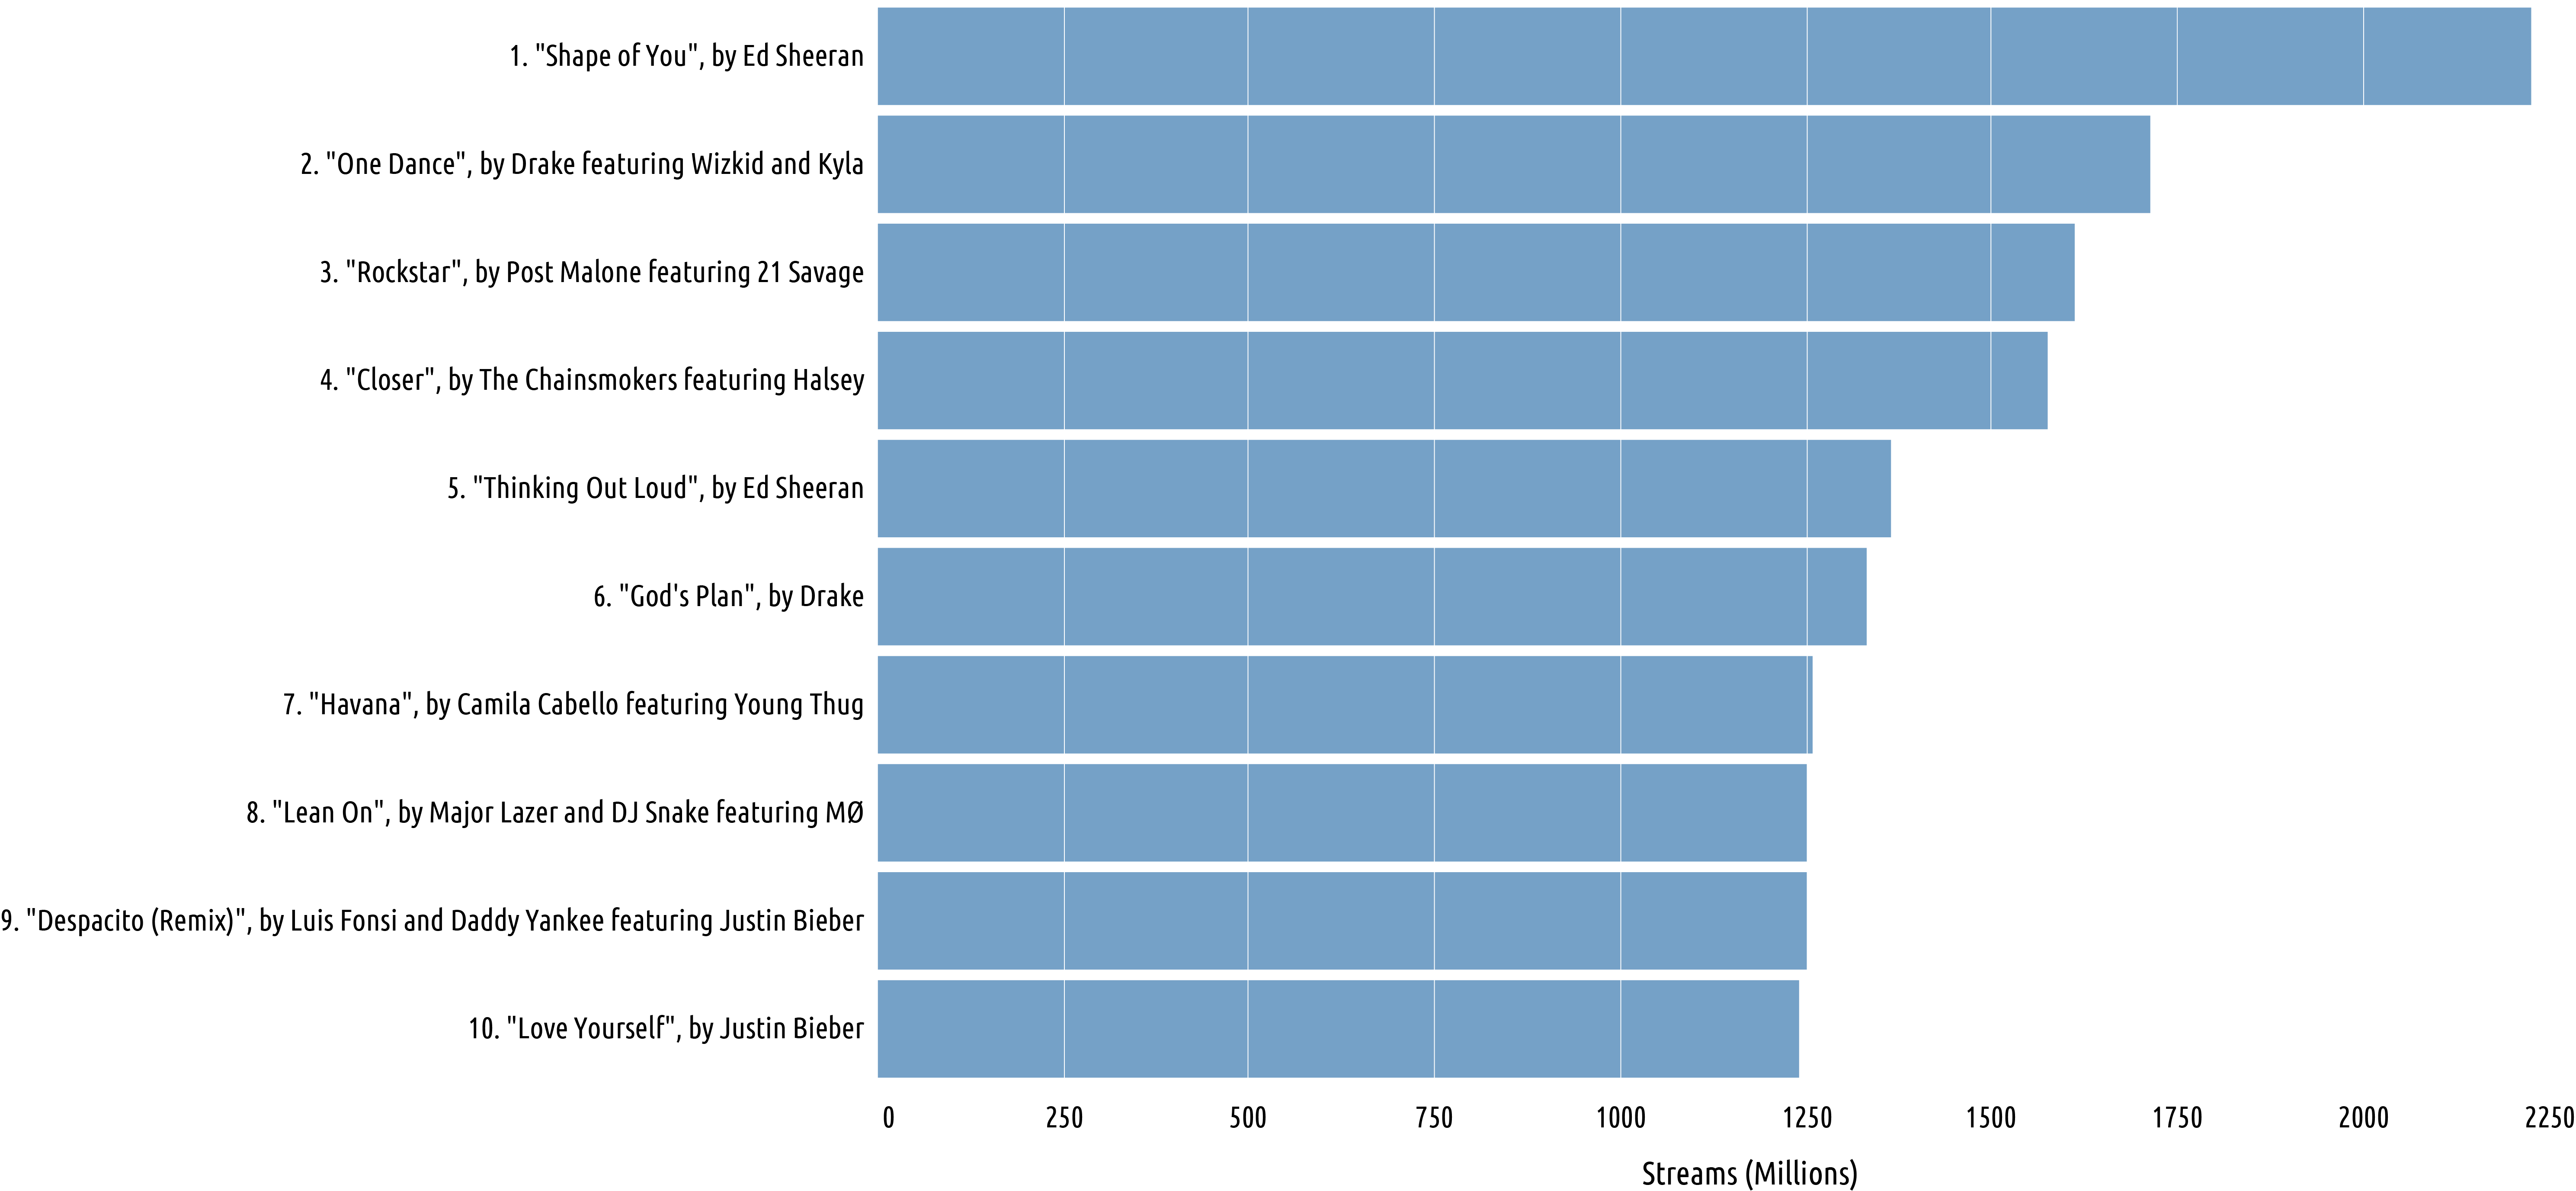
Feels like there are at least three layers we might want the grid to be in:
- behind all data (where it is today)
- in front of all data
- above heatmaps and contour maps, but below scatter. Actually maybe also above bars too, so you could do the "minimal ink" gridlines matching the background and only visible on the bars but still put scatter points on top without the gridlines chopping them up.

Add attribute to affect the z-order of the x and y axes gridlines such that the traces added to my figure do not obscure the gridlines, by default the traces are always drawn on top of the grid lines.