Community Layout
Layout of large networkx graphs with community segmentation
A small package used to visualise community-structured networkx graphs.
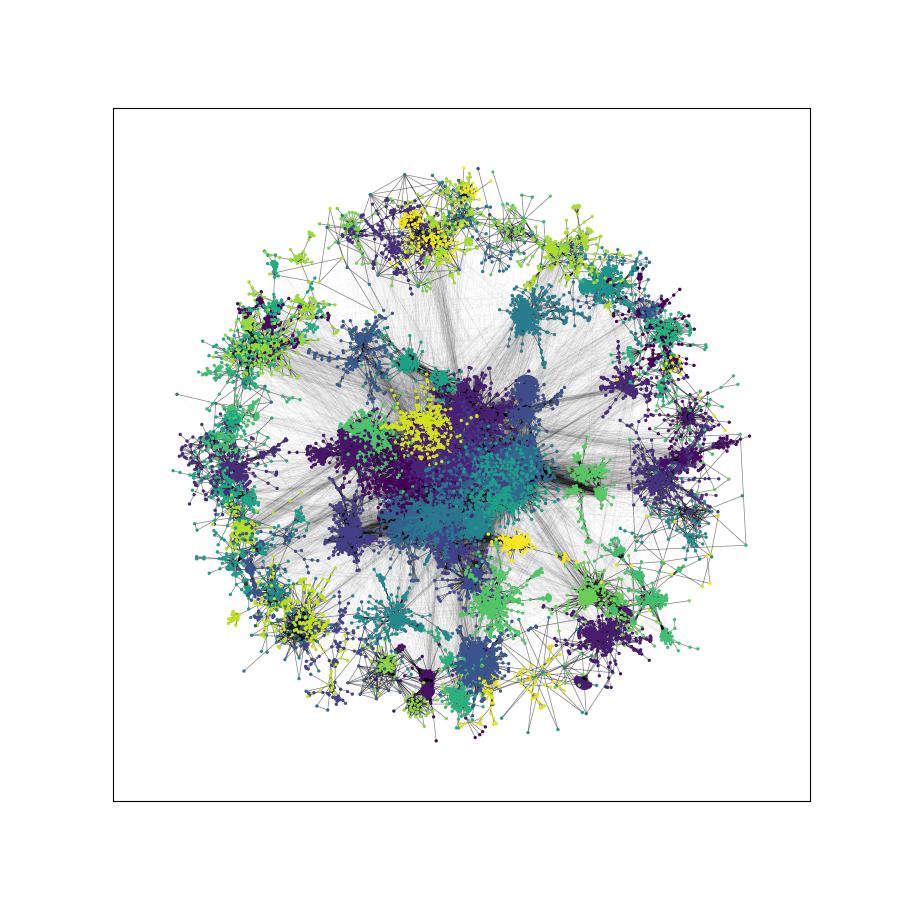
Layout of communities individually, with communities themselves arranged according to their inter-links, allows far faster visualisation of large graphs.
Note: This is an early version, and usage will likely be changed as new functionality is added.
Usage
The layout class is accessed via:
from community_layout.layout_class import CommunityLayoutPosition calculation is during __init__.
After __init__, CommunityLayout(G).full_positions is an dictionary of keys corresponding to node positions, as in networkx layout algorithms.
Basic usage is as follows:
import networkx as nx
from community_layout.layout_class import CommunityLayout

G = nx.gnm_random_graph(2000, 40000)
layout = CommunityLayout(G)
pos = layout.full_positions
There are several parameters that can be changed by the user:
CommunityLayout(self,
                G,
                community_compression = 0.25,
                layout_algorithm = nx.spring_layout,
                layout_kwargs = {"k":75, "iterations":1000},
                community_algorithm = community.louvain_communities,
                community_kwargs = {"resolution":2})
These are designed to work with networkx functions, but custom functions will work assuming similar syntax and that they return the same objects.
community_algorithm can also be a list of pre-determined communities, ie ["community_1":{"node_id1", "node_id2",...}, "community_2":{"node_id3", "node_id4",...}].
community_compression controls the scale compression of individual community sub-layouts.
Lower values will result in each community occupying smaller portions of the overall layout.
Optionally we also include figure plotting:
layout.display(colors = None,
               bundle = False,
               complex_alphas = True,
               ax = None)
Which, if passed ax = matplotlib.Axes, returns the same. If no Axes is passed, it saves a .png in the working directory and calls plt.show().
Note: Edge bundling is currently a much heavier process than the community layout process.
Requirements
Requires the packages numpy, pandas, tqdm, scipy and networkx to be installed.
matplotlib is required for figure plotting. Edge bundling requires datashader and scikit-image.