0todd0000 / spm1d

One-Dimensional Statistical Parametric Mapping in Python
GNU General Public License v3.0
61 stars 21 forks source link

Kinematics comparison | SPM ANOVA with subsequent paired t-tests #226

Closed McBanana33 closed 1 year ago

McBanana33 commented 1 year ago

Hello everyone,

I want to compare a markerless motion capture system to a marker based system and to a IMU based system. For that purpose, I investigate the kinematics during Gait and Squat, probably evaluating a total of 4 joint angles. The data have been captured simultanouesly. I want to normalize the data of each subject to a graph between 0-100% and then compare these values. My approach to identify differences between these systems would be to run multiple SPM ANOVA's for each angle with subsequent post-hoc paired t-tests.

For that analysis I have: 3 factors: Markerless, Marker-Based, IMU 4 dependent variables: 4 Angles

My question: If I understand the post-hoc SPM approach correctly, it will perform a t-test at each point of the normalized graph, resulting in a huge amount of t-tests. Won't this inevitably lead to a type 1 error? As far as I know, the Bonferroni adjustment can be used to help with this problem, which in my case would be alpha = 0.05/3, = 0.0166. Still, is this correction sufficient or are there other ways which would be more appropriate to counteract the type 1 error?

I'd greatly aprecciate your help and thoughts on my approach. Thank you!

0todd0000 commented 1 year ago

Your interpretations are correct except for: "...it will perform a t-test at each point". Let's first consider the case of a single test (e.g. a two-sample t test) before considering post hoc tests.

For a single test it is more accurate to think of SPM's calculations like this:

Just as calculating a mean and a standard deviation (SD) does not represent a "test", calculating a test statistic value (which is basically just the ratio between the mean effect and the SD) also does not represent a test. A test is conducted only when probability calculations are made.

Another relevant interpretation is based on the figure below (from this site). In this figure the "FWHM" parameter represents smoothness, where FWHM = 0 represents perfectly rough, uncorrelated data and where FWHM = $\infty$ represents perfectly smooth data (i.e., flat lines). For purposes of discussion let us say the there are Q points that have been used to characterize the continuum, where Q is often 100 or 101 in real data analysis.


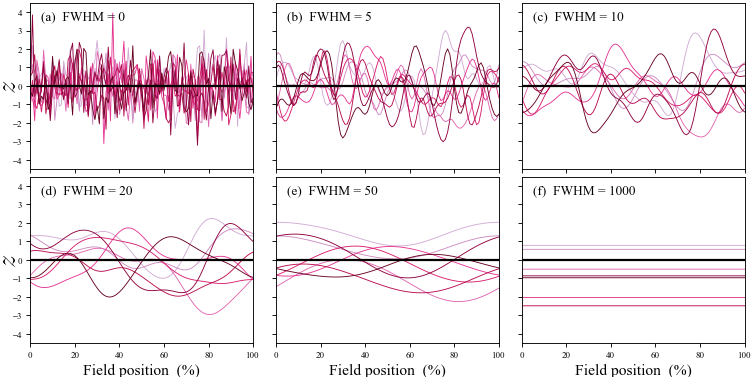
Your interpretation is correct for the case of FWHM = 0, when each of the Q points along the continuum effectively embodies an independent random process. In this case you correctly point out that the Bonferroni correction can be used to accurately control Type I error across the Q independent tests.

At the other extreme, when the data are perfectly smooth ( FWHM = $\infty$ ) there is effectively just a single random process, as all Q points are perfectly correlated with each other. In this case the usual procedures found in many standard software packages like SPSS and MATLAB can be used to accurately control Type I error.

SPM and SPM-related corrections deal with the intermediary case of 0 < FWHM < $\infty$. In this case there is effectively more than one random process but fewer than Q random processes. SPM uses smoothness (in the form of gradient estimates) to estimate the effective number of random processes and thereby control Type I error. Note that using no correction would yield greatly increased Type I error, and using a Bonferroni correction would yield a greatly increased Type II error. Only SPM and SPM-like methods (like those in the Functional Data Analysis literature) can be used to accurately control both Type I and Type II error for case of 0 < FWHM < $\infty$.

A key point is that SPM results are invariant to Q. Sampling the data at Q=100, 1000, or 1 million points greatly affects Bonferroni-corrected results but does not affect SPM results.

Please see this link at spm1d.org for a related consideration.


Finally, to return to your question about post hoc tests...

For post hoc tests there are two levels of corrections:

Continuum-level corrections are those described above. Multiple comparisons corrections are used whenever more than one test is conducted, for example in ANOVA post hoc testing, but also for the case of multiple dependent variables like four separate joint angles. Bonferroni and related corrections can indeed be used for multiple comparisons corrections like these. SPM or related methods should be used for continuum-level corrections. As far as I am aware there is no established or standard methodology for post hoc tests in the SPM and related literatures, and that typical corrections like the Bonferroni correction can be used.

McBanana33 commented 1 year ago

Dear Mr Pataky, thank you for your detailed response! Your explanation of smoothness in SPM was very helpful. Still, I'd like to ask you a few questions:

1) "A key point is that SPM results are invariant to Q. Sampling the data at Q=100, 1000, or 1 million points greatly affects Bonferroni-corrected results but does not affect SPM results." --> Could you explain this with a little more detail? What is the difference between the Bonferroni-corrected results and the SPM results?

2) In order to perform the post hoc t-tests, I'm thinking of using the "ex1d_anova1_posthoc.m" file. I set alpha according to Bonferroni adjustment to 0.05/3, = 0.0166 and run the analysis with my data. Then, I'll receive a p_critical value for each supra-threshold cluster, which I then have to correct using "spm1d.util.p_corrected_bonf". Could you tell me if I understood the process correctly or are there adjustments that I have to make?

Thank you!

0todd0000 commented 1 year ago
  1. The critical Bonferroni-corrected threshold increases as Q increases. In contrast, the critical SPM-corrected threshold does not increase as Q increases (when the continuum length is constant and Q is the number of interpolated points) because the key parameter for SPM is the "smoothness", defined roughly as s = Q x gradient. When Q increases the gradient at each point decreases, making s relatively stable to changes in Q.

  2. That sounds fine!

McBanana33 commented 1 year ago

Hello again,

your response was very helpful, thank you!

McBanana33 commented 1 year ago

Dear Mr. Pataky,

I'm trying to conduct the PostHoc ANOVA analysis and have come across a few more questions.

1) In my understanding, there are two types of p-values for post-hoc tests: One is the p_critical value, which is formed by alpha and the Bonferroni correction. Then there is another p-value, which has a specific value for each supra-threshold cluster. When reporting these individual values, they have to be corrected using "spm1d.util.p_corrected_bonf". Is this correct?

2) In the code I used below there are 4 p-value for the corresponding clusters: 0, 0, 0, 0.00560170549076577 Is the "spm1d.util.p_corrected_bonf" method also suitable for values of 0? When applying it, the p_corrected value remains 0.

3) I have used the available script "ex1d_anova1_posthoc.m" for trying to understand the test. I've added a threshold label and a p-label at the end of my subplot, so my code looks like this:

clear; clc

%(0) Load data: dataset = spm1d.data.uv1d.anova1.SpeedGRFcategorical(); [Y,A] = deal(dataset.Y, dataset.A); %%% separate into groups: Y1 = Y(A==1,:); Y2 = Y(A==2,:); Y3 = Y(A==3,:);

%(1) Conduct SPM analysis: t21 = spm1d.stats.ttest2(Y2, Y1); t32 = spm1d.stats.ttest2(Y3, Y2); t31 = spm1d.stats.ttest2(Y3, Y1); % inference: alpha = 0.05; nTests = 3; p_critical = spm1d.util.p_critical_bonf(alpha, nTests) t21i = t21.inference(p_critical, 'two_tailed',true); t32i = t32.inference(p_critical, 'two_tailed',true); t31i = t31.inference(p_critical, 'two_tailed',true);

%(2) Plot: close all subplot(221); t21i.plot(); ylim([-40 40]); title('Normal - Slow'); t21i.plot_threshold_label(); t21i.plot_p_values(); subplot(222); t32i.plot(); ylim([-40 40]); title('Fast - Normal') subplot(223); t31i.plot(); ylim([-40 40]); title('Fast - Slow')

When running the script, I get the following figure: grafik

My question: 3.1) Why is alpha set at = 0.02? Shouldn't it be the p_critical value, so 0,0169? 3.2) Is the command "t21i.plot_p_values()" not appropriate in this context, because the displayed p-values have to be corrected and are thus false?

I'm sorry to bother you again but I'm looking forward to your reply. Thank you!

0todd0000 commented 1 year ago
  1. In my understanding, there are two types of p-values for post-hoc tests: One is the p_critical value, which is formed by alpha and the Bonferroni correction. Then there is another p-value, which has a specific value for each supra-threshold cluster. When reporting these individual values, they have to be corrected using "spm1d.util.p_corrected_bonf". Is this correct?

Yes


  1. In the code I used below there are 4 p-value for the corresponding clusters: 0, 0, 0, 0.00560170549076577 Is the "spm1d.util.p_corrected_bonf" method also suitable for values of 0? When applying it, the p_corrected value remains 0.

p-values can never be exactly zero, but they can be very small numbers. Multiplying a very small number by a correction factor like 5 or 10 results in another very small number. Very small p-value like these can be reported as "p < 0.001".


3.1) Why is alpha set at = 0.02? Shouldn't it be the p_critical value, so 0,0169?

Alpha is defined as 0.05 in the script. The plot comment (e.g. t21i.plot) does not know about post-hoc testing so yields p_critical and not alpha. This command rounds p_critical when displaying it. Please regard this plot command as providing just preliminary plotting options.


3.2) Is the command "t21i.plot_p_values()" not appropriate in this context, because the displayed p-values have to be corrected and are thus false?

Through t21i.clusters, for example, you can access individual p-values. You can correct all p-values before plotting them.

McBanana33 commented 1 year ago

Thank you so much for your detailed response! You've been incredibly helpful!

McBanana33 commented 1 year ago

Hello Mr. Pataky,

as I am now able to fully conduct the SPM analysis, there is one issue that striked me. As far as I know, the Bonferroni adjustment has to be applied to both, the ANOVA itself and the PostHoc tests. For the post hoc tests, one would divide alpha by the amount of factors, in my case the 3 measurement system. Would mean: 0.05/3 = 0.1677. For the ANOVA, one would divide alpha by the amount of tests conducted. In my case, as I conduct an ANOVA for each angle (3 in total), 2 different planes (sagittal and dorsal) and 2 different movements (gait, squat), this would lead to a total of 12 ANOVAs. Would mean: 0.05/12 = 0.00416. When conducting the SPM with this p-value, of course many times difference in terms of significance can't be found, even though angles differ sometimes to up to 15 degrees. If i were to conduct the analysis with p = 0.05, significances would be found far more often. Is there a different approach of correcting the p-value using the SPM that you might suggest? Thank you!

0todd0000 commented 1 year ago

If you conduct multiple ANOVAs, then yes, a correction should generally be applied across those multiple tests. And yes, a correction should also generally be separately applied to the multiple tests involved in post hoc testing.

Your summary seems correct, but I would summarize it like this:

alpha             = 0.05  # Type I error rate
p_critical_stage0 = alpha / 12  # correction for multiple ANOVA
p_critical_stage1 = p_critical_stage0 / 3  # correction for multiple post hoc tests

The p_critical_stage1 threshold can indeed be quite small. This is a natural consequence of the experimental design: the more variables one separately analyzes (and thus the more tests one separately conducts), and the more factors in the experiment (i.e., 2-way, 3-way, 4-way ANOVA), the less powerful the design becomes. Conversely, one can retain high power by examining as-few-variables and as-few-experimental factors as possible.

So you have two main options:

  1. Correct for all tests (using p_critical_stage0 and p_critical_stage1), or:
  2. Correct for no tests

Correcting for all tests allows you to maintain Type I error control. Correcting for no tests will almost certainly yield Type I error. Many studies in the biomechanics literature choose the second option or something close to it, with an implicit justification that effects will not be discovered if p_critical_stage1 is applied. This perspective is an exploratory perspective, where the goal is to discover effects, even if those effects are false ones. This perspective appears to be acceptable in the literature. In my view this approach is non-ideal because it becomes impossible to distinguish real effects from false ones, and has the danger of yielding a relatively high Type I error rate across studies.

McBanana33 commented 1 year ago

Hello Mr. Pataky,

as another question has come up, I just realized I haven't responded to you. Sorry! By your explanation I've decided to roll with the Bonferroni correction and accept possible Type 2 errors. Thank you once again for your response. My (most likely) last question I have: If I decide to do the non parametric ANOVA test due to normality violations in my data, is it then acceptable to follow up with the same post hoc tests that I'd usually do for parametric analysis (in case of significances), or is it required to use an alternative? I'm looking forward to your reply.

0todd0000 commented 1 year ago

If the ANOVA is non-parametric then I'd recommend also using non-parametric post hoc procedures.

McBanana33 commented 1 year ago

Thank you for your response. If I'm not mistaken, there's no example in the directory for a non-parametric posthoc anova analysis. I can only seem to find an example for the parametric alternative. Since my coding experience is very limited, I've tried to create a non parametric posthoc test and would like to know if this approach is reasonable.

For the parametric posthoc test, the plotting for one comparison basically works like this: t31 = spm1d.stats.ttest2(data_X, data_Y); t31i = t31.inference(p_critical, 'two_tailed',true); t31i.plot();

Therefore, I've set up my non-parametric test as follows, orientating myself at the example for the non-parametric ex1d_ttest2.m file: t50 = spm1d.stats.nonparam.ttest2(data_X, data_Y); iterations = 924; t50i = t69.inference(p_critical, 'two_tailed', true, 'iterations', iterations) t50i.plot();

Does this arrangement make sense? If so, I've noticed that the result of the non-parametric test tends to very every now and then when I repeat the measurement. If I understood correctly, this might be due to the relatively low iteration size. I've read in another thread in this forum that you recommend the iterations set at "The maximum possible number of iterations (for small sample sizes)". In my case, 924 is the highest that works. How does one deal with the deviations in result? Thank you!

0todd0000 commented 1 year ago

Your code sounds fine. You might also want to consider using the factorial add-on package that facilitates non-parametric post hoc testing: https://spm1d.org/Addons.html

I don't quite understand the questions in the last paragraph in your posting above, so if the add-on package doesn't solve these issues please let me know.

McBanana33 commented 1 year ago

That's very interesting, I'll have a look into it. About the last paragraph: What I mean is that the result regarding the significance varies from time to time when I run the code. I'll illustrate with an example:

Sometimes, the result is not significant: grafik

On the other hand, after running the code multiple times, sometimes I do have a significant result: grafik

I use the exact same code, but the result seems to differ. What could be the reason for that and how should the result be interpreted or is there a way to fix this issue? I was thinking that maybe it has something to do with the "iterations" that are used in "t50i = t69.inference(p_critical, 'two_tailed', true, 'iterations', iterations)". Is there another value that I should set it to? Currently it's set at 924 as this is the maximum value that I can set it to, otherwise I get an error stating "Number of specified iterations (925) exceeds the maximum possible number of iterations (924)".

I've read in your documentation that "Setting iterations to “-1” performs all possible permutations." Is this maybe a reasonable approach? To be honest I'm not fully sure what the permutations do and if it's desirable to perform all possible permutations. However, if I set it to -1, I've noticed that the result of the non-parametric test does not seem to differ to the paramatric t-test... (Just out of curiosity, I also ran the parametric test simultaneously). Thank you!

0todd0000 commented 1 year ago

Yes, I'd suggest using all possible permutations if the total number of permutations is relatively small (e.g. less than 100,000).

The result you see is expected when the total number of permutations is small (less than approximately 10,000). The results of permutations tests numerically stabilize as the number of permutations increases, and usually they stabilize only after about 5000 or 10,000 permutations.

"Permutations" are random re-labelings of the observations. In a two-sample t-test with five observations for each group, for example, the original labels can be expressed as "AAAAABBBBB". One permutation of these labels is "ABAAABBBAB". Another permutation is "BBABABAABB". Permutations tests calculate test statistics for all (or a large number of) permutations to build a distribution of test statistic values, and p-values are calculated from this permutation distribution. A good article about this permutation process as it pertains to SPM is Nichols & Homes (2002):

Nichols, T. E., & Holmes, A. P. (2002). Nonparametric permutation tests for functional neuroimaging: a primer with examples. Human Brain Mapping, 15(1), 1-25.

McBanana33 commented 1 year ago

Thank you for your response! I'll continue to use all possible permutations. Another short question: How'd you proceed if the post-hoc test shows significant results for periods of the gait cycle which are not significant in the ANOVA? I've seen that on your website you mention that the post-hoc tests are generally not valid and post-hoc results that don't agree with the main ANOVA shouldn't be considered. An example:

Main ANOVA: grafik

Subsequent post-hoc test: grafik

As you can see, during ~10-20% of the gait the post-hoc analysis shows significant results, while the ANOVA does not. How would one approach this result in the discussion? Just focus on the part that agrees with the ANOVA and mention that the other part that doesn't agree with the ANOVA should be neglected due to limitations of the SPM posthoc analysis? Thank you!

0todd0000 commented 1 year ago

The ANOVA in the first figure above uses alpha=0.005. The post hoc threshold must be lower than this, so 0.017 is an inappropriate threshold. If you reduce the post hoc threshold from alpha=0.005 then the results may be qualitatively more similar.

Regardless, post hoc analyses should be regarded most generally as qualifications of the main ANOVA results. Any apparent disagreements are caused by imperfect post hoc calculations / procedures, so I'd recommend against reporting them.

As a technical note: this is a limitation of spm1d, which only has a limited range of functionality implemented. It is not a limitation of SPM (as a methodology); appropriate post hoc procedures can in fact be derived. However, post hoc procedures are far more complex for nD data than they are for simple 0D data, so that is why they're not yet implemented in spm1d.

McBanana33 commented 1 year ago

Thank you for your response. Adjusting the threshold does indeed make the results more similar, but there are still some disparities between the main ANOVA and post-hoc analyses.

"Any apparent disagreements are caused by imperfect post hoc calculations / procedures, so I'd recommend against reporting them." --> Do you mean that you'd recommend not reporting the results at all or only focus on the part that agrees with the main result and neglect the rest that doesn't? If only reporting the agreeing result, do you have a source that I could refer to regarding the limitations of the post hoc analyses? This way I could justify the part that doesn't agree with the main result.

Thank you!

0todd0000 commented 1 year ago

Apologies for the ambiguity. I'd suggest not reporting any post hoc results that disagree with the main test results.

There is no specific reference that I am aware of. I think this idea stems from the nature of post hoc testing. Post hoc testing is meant simply to clarify main test (e.g. ANOVA) results. If there are no significant main test results then post hoc tests don't make sense. For 1D data, if the test statistic fails to cross the critical threshold at time=50%, for example, but post hoc analyses do cross the threshold at that point, it does not make sense to report the post hoc results as significant because this disagrees with the main test.

McBanana33 commented 1 year ago

No problem, I'm very grateful for your help.

Just to clarify: "I'd suggest not reporting any post hoc results that disagree with the main test results." --> Do you mean that it's reasonable to still mention the areas of the post hoc result that agree with the main ANOVA, or do you mean that the whole post hoc result is insufficient and shouldn't be reported at all?

Let me illustrate my question with the 2 pictures I posted yesterday (assuming that both alpha level would be adjusted properly): Would it be okay to claim that there are differences in the post hoc between ~60-80% of the gait (because it matches with the ANOVA)? Or is it better to completely discard the whole post hoc because the post hoc test shows significant results at ~10-20% of the gait cycle while the ANOVA doesn't?

0todd0000 commented 1 year ago

Post hoc results mustn't contradict the main results. So I'd report it as something like this: "post hoc analyses suggest that the effect observed in ANOVA at time=TTT was predominantly due to a difference in A1 vs. A2".

McBanana33 commented 1 year ago

Thank you Mr. Pataky! I really aprecciate your help! :)