-
In PmayPy Gui, you are able to plot equal area plots for a single specimen with a line that connects that data points in order of their measurement-demagnetization sequence. (See example below.)
W…
-
While the flex decoder is looping the message received in a frame with a group message with the capcodes index made in the previous frame that contained the short instructions, there could also be ano…
-
**What command was run:**
ipmag.zeq_magic
**What happened:**
~/PmagPy/pmagpy/ipmag.py in zeq_magic(meas_file, spec_file, crd, input_dir_path, angle, n_plots, save_plots, fmt, interactive, spe…
-
I run this code block:
```
# Plot a figure axis
fig,ax=plt.subplots(1,2,figsize=(12,6))
#Plot Zijderveld plot on axis
plot_zijd_data(ax[0],zijd_data,Ts_base)
#Choose a new specimen and get d…
-
Hello,
I'm looking for a good dependency injection framework for C++. I currently found some interesting frameworks, I think the best known frameworks are Wallaroo, [Boost].DI and your framework go…
-
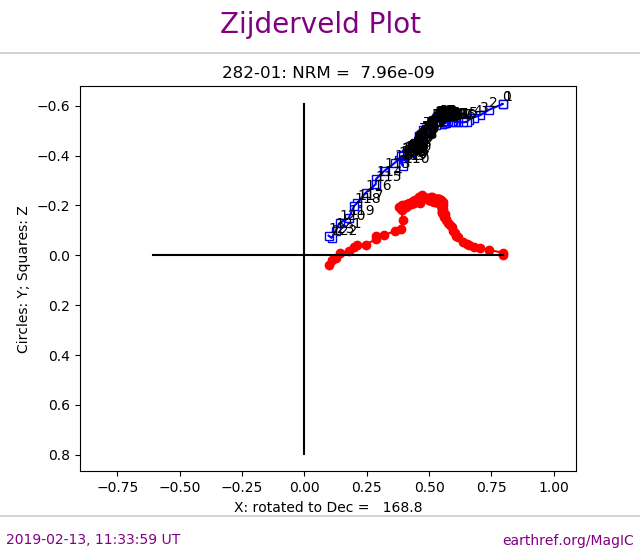
We need a legend printed on the graph, detailing the meanings of the open and closed points on the Zijderveld plot.
-
Gary Acton writes: ‘I noticed in the PuffinPlot manual that the authors suggest anchored PCA is the primary PCA to use. I don't actually agree with that as many data fail to decay precisely to the ori…
-
It seems relatively common to have North on the positive Z axis on a Zplot (see e.g. Dunlop 1979, Wilson and Roberts 1999). Dunlop recommends making the x axis the intersection between the vertical pr…
-
For example in :
https://earthref.org/MagIC/16418:

https://earthref.org/MagIC/1…
-
Goals:
1. Each plotting program must work on the command line, in a notebook, and in tests.
2. Each command line program should have main() function that is only for the command line logic, and c…