-
#### Expected Behaviour
Scatter chart type shows lots of dots on an X/Y axis
#### Actual Behaviour
.
Some modifications are needed to use it.
I want to discuss what should happen in this repository and what not.
I already …
-
I want to be able to do something like in this demo

But I want to do it without recre…
-
Following up on #93. Some new features (as listed at https://frappe.github.io/charts) include:
- Mixed type axis datasets
- Stacked bar charts
- Value over data points
- Y Markers and regions
- D…
-
This may just be an oversight on my part - but I am not understanding how I can pass a series of configs to the Chart item?
Instead of passing `type="line"` in the `` item, is it possible to just …
-
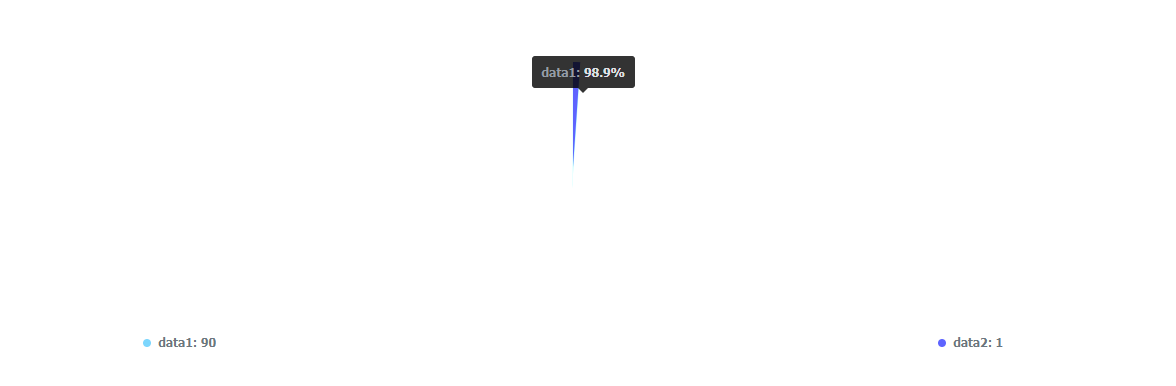
using pie chart display problems,High proportion of the data is not displayed
-
I think typing don't support [Heatmap](https://frappe.io/charts/docs/basic/heatmap) chart.
Following frappe documentation we have to pass data using `dataPoints` instead of `labels` and `values`.
``…
-
#### Expected Behaviour

#### Actual Behaviour
Well-rounde…
-
#### Expected Behaviour
The pie chart to draw on the page
#### Actual Behaviour
Nothing is drawn except the legends on the chart
#### Steps to Reproduce:
Here is a pen for it: https://codepen.i…
-
#### Actual Behaviour

#### Steps to Reproduce:
```
{
…