-
**Describe the bug**
Line color recycling broken for first color when adding a new equation
**Steps To Reproduce**
1. Add a couple equations in graphing mode
2. Delete all equations
3. Enter a …
-
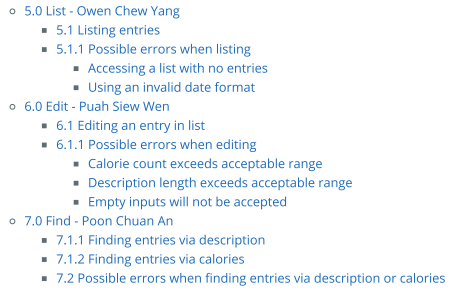
The subsections like 10.1 and 10.1.1 were all aligned it was non-intuitive t…
-
When plotting data using pcolormesh on a basemap projection (or a cartopy projection) I notice strange lines appear when I set the alpha value to less than 1.
Example code:
```
from mpl_toolkit…
-
@thorrak would you consider a feature to set the axis value ranges manually? I just added temp control via a brewpi and most of the temp data is unreadable because the axis range is 0-90F but the mon…
-
When multiple GPSs are enabled MP's Low Browser's Show Map seems to be intermittently switching between GPSs when graphing "GPS".
 to plot something by ``matplotlib`` python package, but flutter-pi runs without X11.
Therefore, my …
-
· have a look at how EEG works and what they are.
· take a look at the links in the database for EEGs.