-
The issue which is not created via https://recharts.github.io/recharts-issue-helper will be closed immediately.
---
Hi!
There have been a few issues about Gantt/Timeline chart support, all of …
-
Not working
Could it be that the “hint” is not working correctly?
It should be smaller and in italics, right?
After -> 18e18d8f6600b57224c5853bbef7a329f66d703c
Problem see in pictures:
#4298…
-
Thumbs up for Alberto for all the hard work has been done so far. I know current version is still in beta, but it would be highly appreciated to have Timeline chart as a part of this library. To draw …
-
### Summary
The feature allows users to mark important data points, trends, or events directly on the chart, providing better context and aiding in data analysis and storytelling. Annotations could i…
-
I'm working on a basic graph with one column being date and one column being a number. I'd like to use a timeline chart where no area below is shaded but it appears the chart for timeline and line are…
-
## Core problem
We currently don't have a good way to handle categorical variables across time in chart views. We usually plot them as a map and without a chart (see [WB's income groups](https://ourw…
-
### What happened?
**Problem Statement:**
Incorrect Duration calculation in Tooltip and inappropriate representation of Job flow
**Description:**
**State Timeline Panel:**
1. We created a table for S…
-
### Feature Requests
In TimeLineView it will be great add, Arrows connecting Events for showing dependency just like in Gantt Chart so that while having fullCalendar package already we don't have to …
-
Examples:
https://vaadin.com/docs/v8/charts/java-api/charts-timeline

https://ww…
-
Like the one from WakaTime or Hakatime:
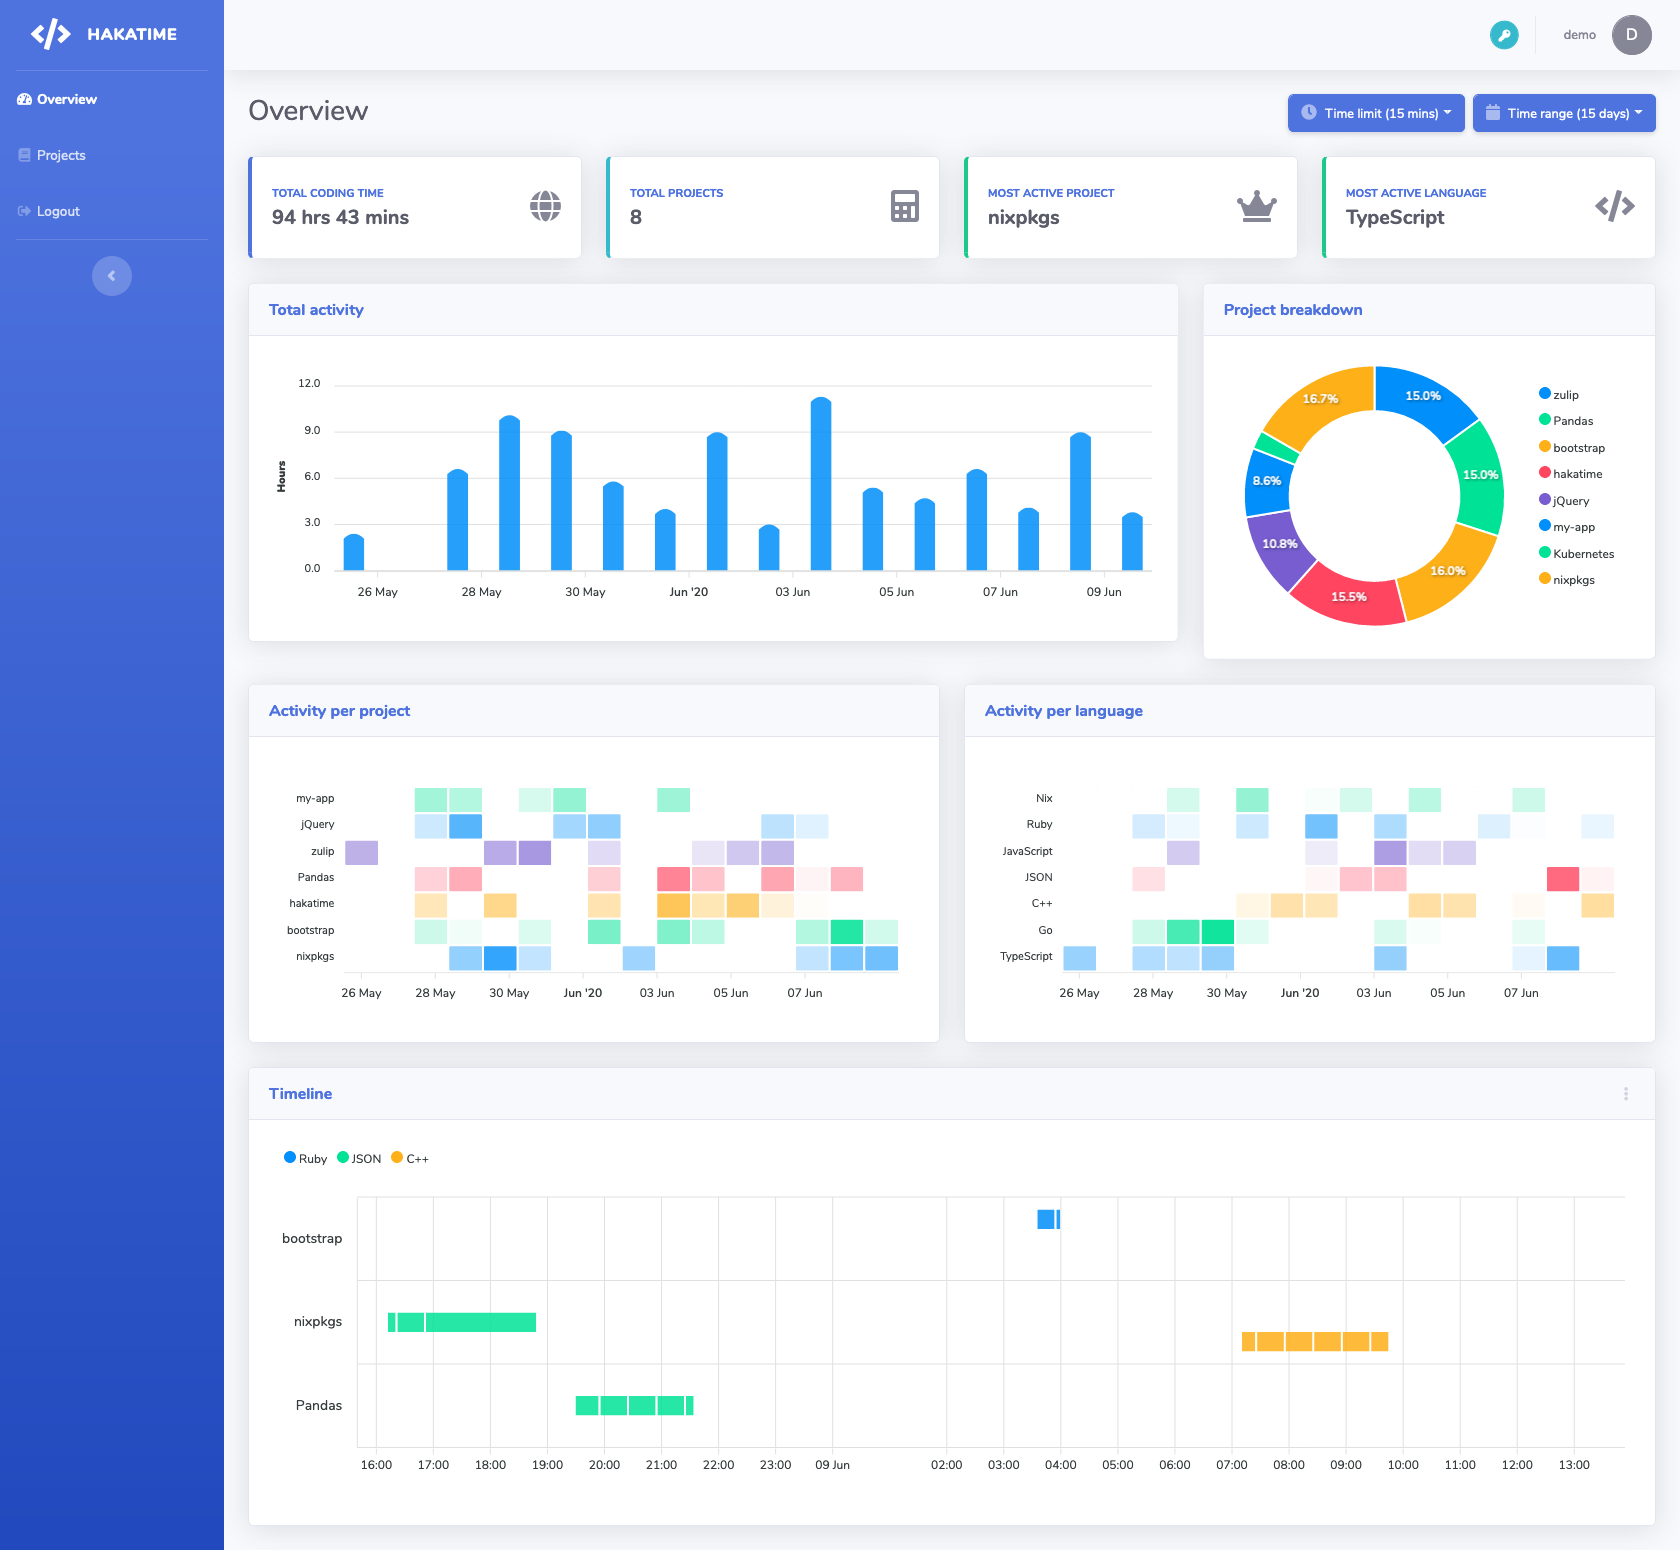
muety updated
10 months ago