 russfiedler
commented
5 years ago
russfiedler
commented
5 years ago The blockiness was an issue that we kind of glossed over yesterday at the start of the TWG meeting. i.e. implement "patch" interpolation for the salt field to be used in restoring.
 aekiss
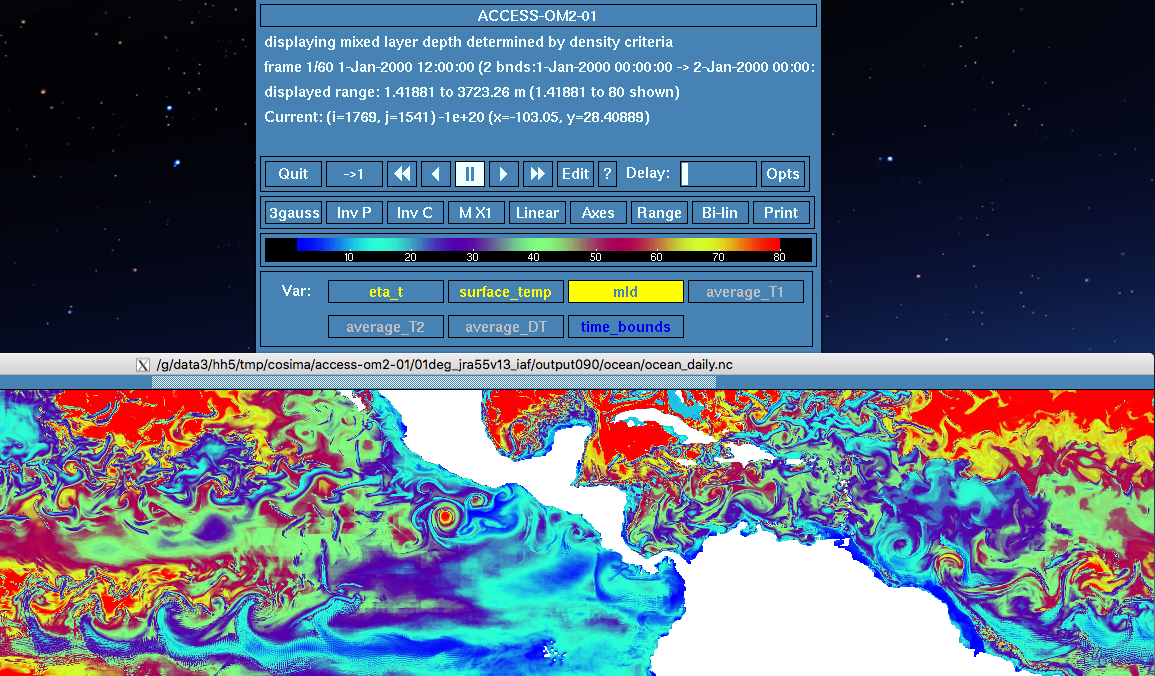
 nichannah
 StephenGriffies

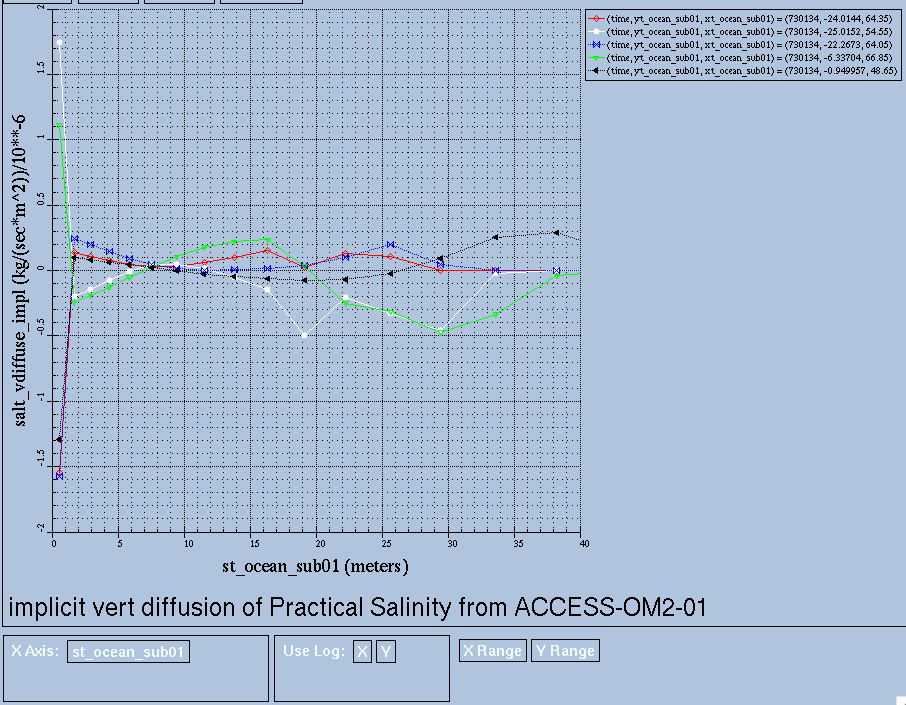
 ...with no obvious difference from at the non-noisy points:
 (ignore the horizontal lines with no marker points - these are a plotting glitch).

 rmholmes


@ChrisC28 noticed that there is grid-scale noise in monthly averages of these fields for the top 5-10 metres in the Indian Ocean:
e.g. in
/g/data3/hh5/tmp/cosima/access-om2-01/01deg_jra55v13_iaf/output090/ocean/rregionindian_ocean_west.nc