COSIMA / access-om2

ACCESS-OM2 global ocean - sea ice coupled model configurations.
21 stars 23 forks source link

Equatorial thermocline biases #134

Open rmholmes opened 5 years ago

rmholmes commented 5 years ago

This would be for consistency with the new 0.1-degree run.

A constant background diffusivity of 1e-6 would improve the simulation of the equatorial thermocline (as tested in some MOM-SIS runs) without changing things much in the mid-latitudes (observations would suggest a value of 1e-5 in the mid-latitudes).

aekiss commented 5 years ago

In the paper we noted the excessively sharp tropical thermocline in ACCESS-OM2-01 and attributed it to the lack of explicit vertical diffusion and (presumably) reduced numerical diffusion in this run.

RYF spinup 7 (/g/data3/hh5/tmp/cosima/access-om2-01/01deg_jra55v13_ryf8485_spinup7) was a test run for new 0.1-degree spinup, which used a constant background vertical diffusivity of 1e-6

&ocean_vert_mix_nml
    j09_diffusivity = .true.
    j09_bgmin = 1.0e-6
    j09_bgmax = 1.0e-6
    j09_lat = 20.0

Here's how the mean of the last 10 years of 01deg_jra55v13_ryf8485_spinup7 compares to 1998-2017 in the IAF runs. There was vertical diffusivity in the 1-degree run but not in the 0.25 or 0.1 deg IAF runs. The 0.1-deg runs had KDS75, whereas the others were KDS50. Spinup 7 was only a 20-year run, so only had 10 years to diverge from the WOA initial condition before the 10-year averaging period. Some differences may also be due to the differing forcing (84-85 RYF rather than IAF).

None of the profiles is particularly close to the observational estimate at 0N, -140E. Spinup 7 is closer than ACCESS-OM2-01 to the 1 and 0.25-deg profiles below ~120m, but more different (and mostly further from obs) in shallower regions. The temperature gradient is not much different from before, i.e. still much steeper than obs. It is remarkable how similar the 1 and 0.25-deg are, given that 1-deg has explicit vertical diffusivity and 0.25 doesn't (but presumably more numerical diffusivity than 0.1-deg).

It's unclear whether this superficial comparison with a short RYF run provides enough evidence to decide whether adding explicit vertical diffusivity is a good idea. But it looks relatively benign at least.

The plot notebook is here if anyone wants to dig deeper: https://github.com/aekiss/notebooks/blob/master/Equatorial_Pacific-spinup7.ipynb

Screen Shot 2019-07-11 at Thu 11-7 2 46pm 1

Screen Shot 2019-07-11 at Thu 11-7 2 36pm

StephenGriffies commented 5 years ago

Could be the optics are more important within this regime of small vertical diffusivities. What do you think @rmholmes ?

rmholmes commented 5 years ago

Interesting. This is not quite the change in the upper 100m or so that I was expecting. Optics could be something to look into. The Ri-based mixing scheme also plays a big role at those depths.

It is remarkable how similar the 1-degree and 1/4-degree thermoclines are, despite their quite different zonal velocity structure.

I would like to dig into this more, next week once I'm done conferencing.

aekiss commented 5 years ago

Here are updated plots, now including 01deg_jra55v13_ryf9091, which at this stage is a 7-year average (after the first 10 years which was skipped).

Interesting that there's such a difference between 01deg_jra55v13_ryf9091 and 01deg_jra55v13_ryf8485_spinup7.

Screen Shot 2019-07-22 at Mon 22-7 3 23pm

Screen Shot 2019-07-22 at Mon 22-7 3 42pm

aekiss commented 5 years ago

Reviewer 1 suggests the warm bias may be due to excessive downward shortwave rather than insufficient diffusion - @StephenGriffies is this what you were thinking?

StephenGriffies commented 5 years ago

My thought was only that shortwave can affect downward heating in upper ocean, so it is worth a try to see whether it impacts on the bias. But I thought that @rmholmes tried and did not see much sensitivity...? Do we have a clean expt to help with the revision response?

rmholmes commented 5 years ago

I haven't tested different shortwave penetration schemes.

Yes excessive shortwave would give you a warm bias, but it's not clear why this would be different/worse at 1/10th degree. I feel that the vertical resolution increase must play a role...

Would the RYF9091 be warmer just because of a CC signal?

The comment on the link between the bias and vertical diffusion comes from the MOM-SIS 1/4 and 1/10-degree configurations. The below plot shows equatorial Pacific temperature biases for 3 MOM025-SIS configurations with 1e-6 (top left), 1e-5 (top right) and 0 (bottom left) background diffusivity at the equator. MOM01 (bottom left) clearly has a strong cold bias and a thermocline that is too sharp (like the ACCESS-OM2-01 results).

EqPacTbias

So based on the MOM025 results, adding in a 1e-6 background diffusivity should improve things, and it has with respect to the cold bias and the sharpness of the thermocline. However, it may have made things worse above 100m.

I feel that it is tough to make too many conclusions from these runs given the different forcing and averaging periods. The cleanest step forward would be to decide on a clean protocol for comparisons (e.g. an X-year run started from the same initial condition) and do a parameter sensitivity study. However, since this is the 1/10th-degree, it could be expensive. On the other hand, my experience from previous Pacific-basin ROMS runs is that the circulation adjusts to changes pretty quickly (we might only need 5-year runs?).

If we went down this path I'd want to test 1) shortwave penetration scales, 2) KPP Ri-based shear instability parameters, 3) an equivalent 0m2s-1 background diffusivity run. The nice thing about #2 is that it acts as an independent switch on the equatorial regions, as the shear instability parameterization is really only active here and a little in the equatorial Atlantic and off the coast of Somalia.

aekiss commented 5 years ago

Here are the mean SST biases relative to WOA13, as in fig 10 of the paper, but for slightly different year ranges. The plot script is here.

The RYF runs (d,e) started from WOA13 but have had the first 10 years omitted. Spinup 7 (d) used RYF 1984-85 and shows considerably reduced equatorial Pacific warm bias relative to (c), whereas (e) is RYF 1990-91 and has a reduced warm bias amplitude in the east but much greater westward extent. They both have uniform vertical diffusivity of 1e-6, whereas (b) and (c) have none.

I'm not sure we can conclude much from these, as the differences are probably mainly due to forcing biases (and resulting circulation biases) in those particular RYF years, so they don't tell us much about the impact of vertical diffusivity.

I've also re-plotted the transects and profiles above using latest (longer) RYF 1990-91 runs but they are visually nearly identical to before.

Screen Shot 2019-08-09 at Fri 9-8 4 24pm

aekiss commented 5 years ago

I'm setting up new default configurations which will be put in https://github.com/COSIMA/access-om2/tree/master/control

We need to decide whether to use a constant background vertical diffusivity of 1e-6 for all the 0.25 and 0.1 deg configs, or leave the diffusivity as zero, as it was in the paper.

Does anyone have any thoughts on this?

Using 1e-6 at 0.1 deg has the advantage of consistency with 01deg_jra55v13_ryf9091, which is intended to be the new 0.1 deg RYF control experiment. We don't know as yet what effect it will have in an IAF run.

1e-6 at 0.25 has never been tested (as far as I know all runs have used zero). Should we test this before making a change to the default configs?

AndyHoggANU commented 5 years ago

My intuition is that the 0.25° is already overly diffusive due to numerical issues, and that we are justified in retaining zero background diffusivity, just for this resolution. But open to hearing arguments against this!

rmholmes commented 5 years ago

Like I said above, my argument for adding in a background diffusivity at 1/4 and 1/10th-degree comes from those MOM-SIS CORE-NYF-forced T-bias plots above. Perhaps this config/forcing is not sufficiently close to ACCESS-OM2, and so more testing is required.

1e-6 is not a large background diffusivity. Most models use 1e-5.

It is also worth noting that with zero background diffusivity numerical mixing exceeds all other sources of mixing at both 1/4 and 1/10 (at least at warmer temps, at colder temps it depends on Redi/GM). This has caused problems in the past for publications (reviewers saw it as a big red flag).

If you're happy with the current configuration then stick with it. Otherwise, at 1/4-degree I'd be happy to test a few different options if you can suggest a good testing bed (025deg RYF84-85)?

aekiss commented 5 years ago

Agreed, 1e-6 is a pretty small diffusivity - e.g. the diffusion length over 10 years is only about 35m. So it should be pretty harmless?

The new default configurations should be ready soon, so they would be a good basis for 025deg tests. Probably best to use RYF9091 as this is what we have in the new 0.1deg RYF control experiment.

rmholmes commented 4 years ago

As presented in the MOM meeting today, I have done a new set of cleaner tests on the impact of background diffusivity on the ACCESS-OM2-01 tropical Pacific thermocline in the new RYF9091 control experiment. The results are contained in this notebook.

Conclusions are still a little fuzzy but I think can be stated as:

The model thermocline also appears too flat compared to WOA13 (in both old IAF and new RYF9091 runs).

In the meeting we discussed a few other parameters to potentially look at:

I'll keep working on this while I can.

aekiss commented 3 years ago

Pavel has found that ACCESS-OM2-01 develops a growing equatorial cold bias at about 50-150m depth. This is undermining the performance of the model for EnKF data assimilation, so it would be good to reduce this bias as much as possible.

This bias seems to correspond to the bias in the GMD paper's fig 12e. The cold bias is present at the start of the 0.1deg run, which began from a 40-year RYF8485 spinup from WOA13 climatology, and decreases with time (fig. 9). We attribute the cold bias partly to this biased initial condition (see sec 4.1.3 in the paper) but also suggest that low vertical diffusivity may contribute (sec 4.1.4).

We now have three 61-year IAF cycles at 0.1deg, plus six IAF cycles at 1deg and 0.25deg, so it would be good to investigate this in more detail.

Key questions are:

I would be good to begin with some plots such as:

We could also look at differences between IAF and RYF runs.

Once we have a better characterisation of the problem we could to try a few ~5-yr experiments with parameter tweaks.

aekiss commented 3 years ago

Here are the relevant figures from Kiss et al. (2020). For the 0.1 degree run they show a large equatorial cold bias in the permanent thermocline in the Atlantic and Pacific, and a weaker cold bias in the Indian Ocean. This cold bias is not seen at coarser resolution. The cold bias is present at the start of the 0.1deg run, which began from a 40-year RYF8485 spinup from WOA13 climatology, and decreases with time (fig. 9). We attribute the cold bias partly to this biased initial condition (see sec 4.1.3 in the paper) but also suggest that low vertical diffusivity may contribute (sec 4.1.4).

The new IAF cycles began from WOA13, so it would be interesting to re-do this Hovmoller with the new runs, and also restrict it to the tropical and mid-latitudes (say, 40S-40N).

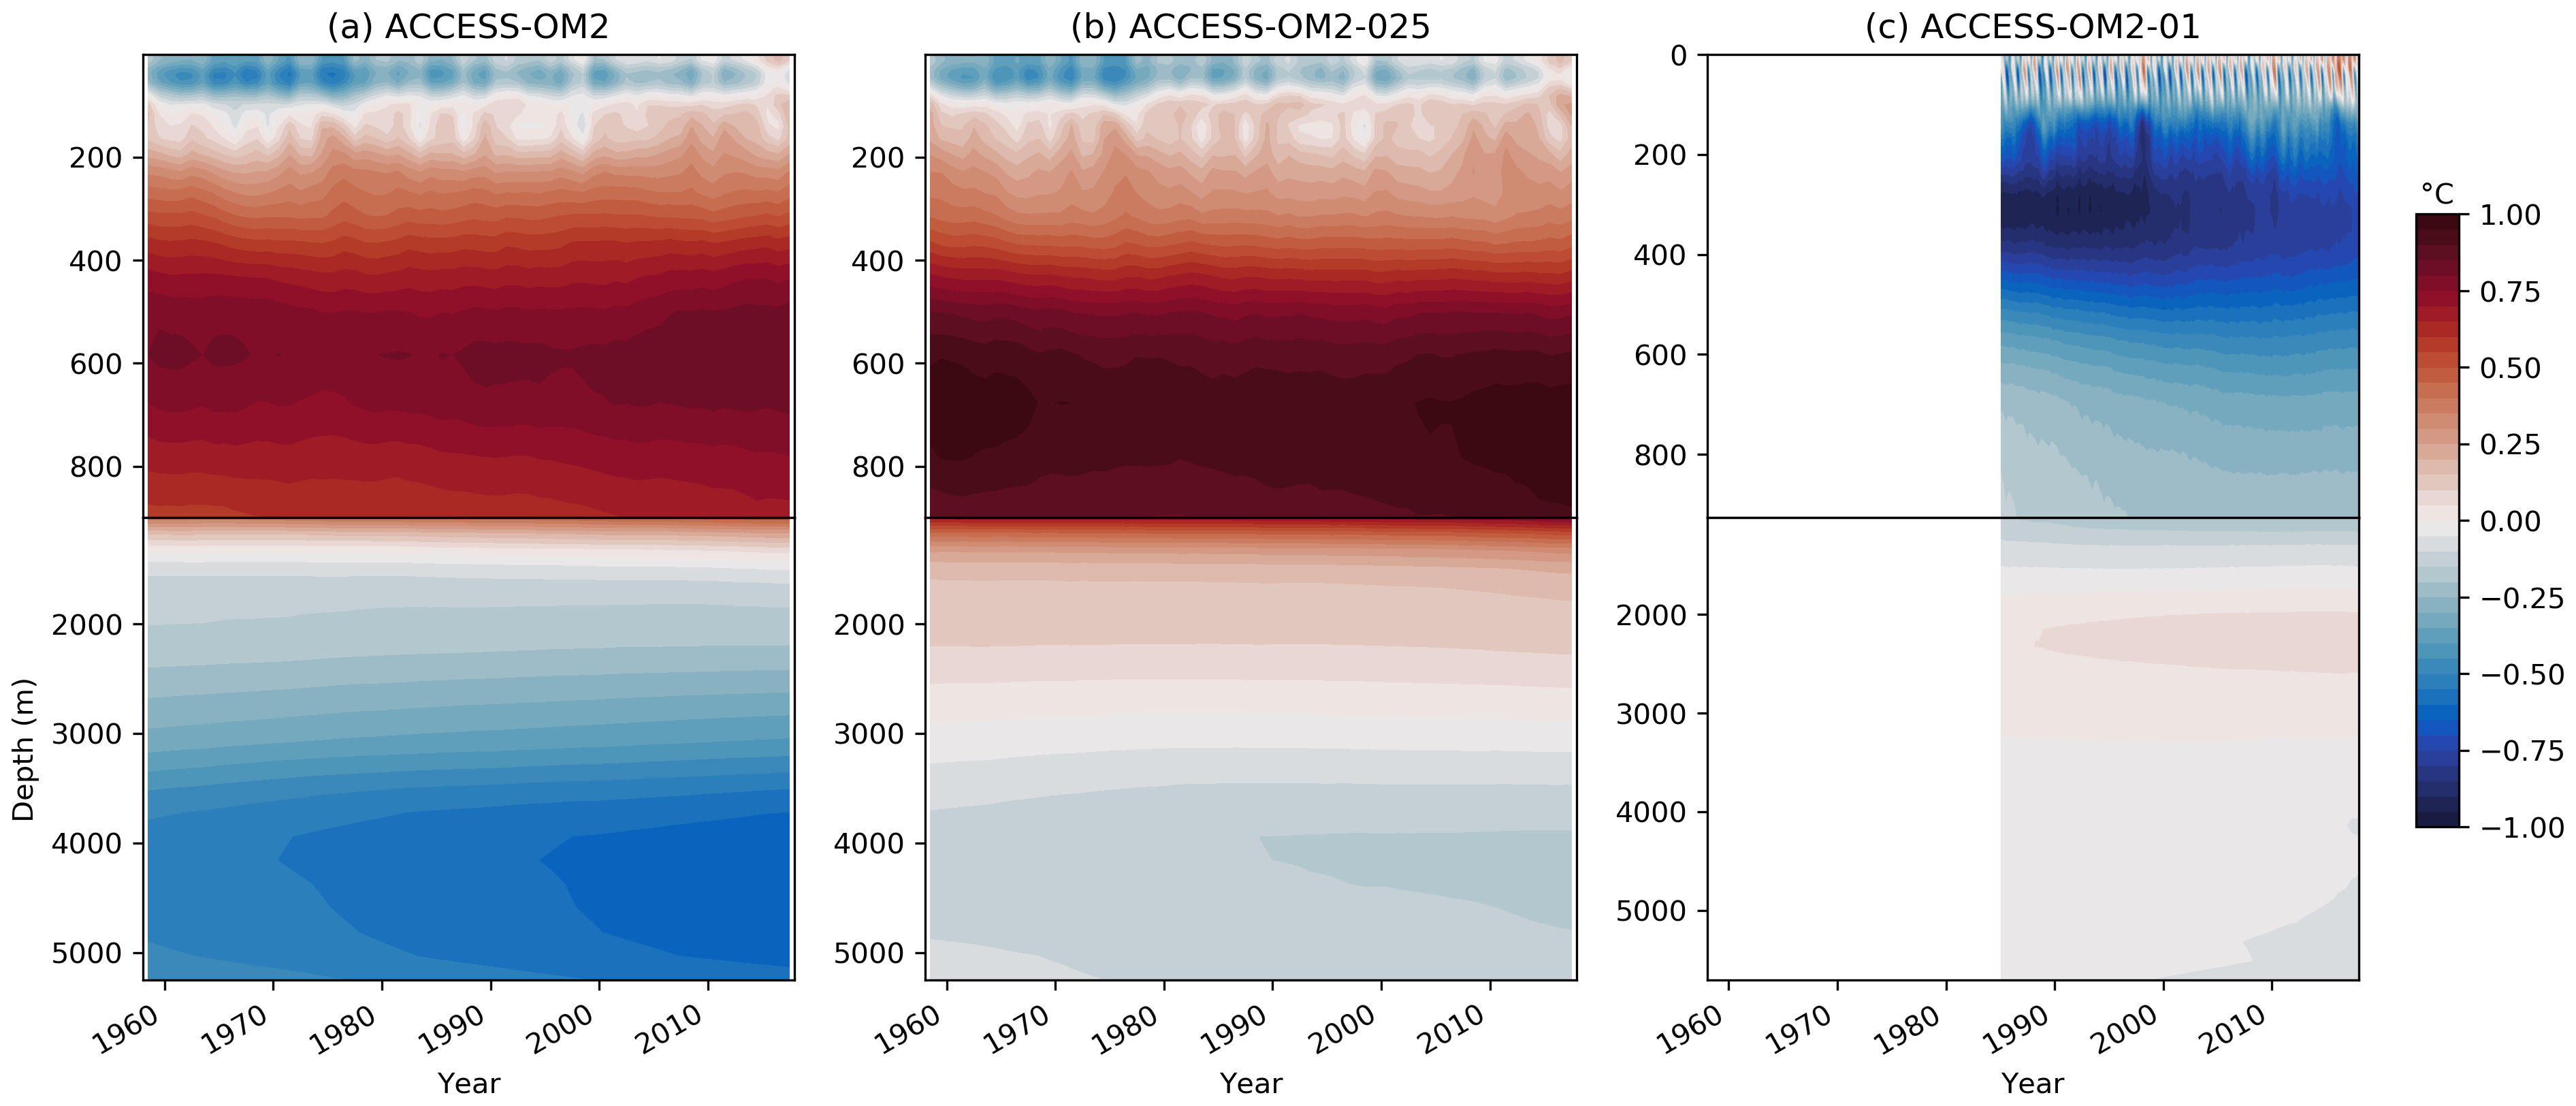
Figure 9: Horizontally averaged temperature anomaly (C) relative to WOA13 as a function of depth and time over the last interannual forcing cycle for (a) ACCESS-OM2, (b) ACCESS-OM2-025, and (c) ACCESS-OM2-01. Panels (a) and (b) are annual means, and (c) shows monthly means.

Figure 12: Zonally averaged temperature bias relative to WOA13 for (a) ACCESS-OM2, (c) ACCESS-OM2-025, and (e) ACCESS-OM2-01. Zonally averaged salinity bias relative to WOA13 for (b) ACCESS-OM2, (d) ACCESS-OM2-025, and (f) ACCESS-OM2-01. The WOA13 zonally averaged temperature field is shown in (g), and the WOA13 zonally averaged salinity field is shown in (h). Model fields are 1993–2017 means.

Figure 20: Meridional transects of 1993–2017 mean potential temperature (upper panels) and salinity (lower panels) in the central Pacific Ocean, along longitude 150W, near the WOCE/GO-SHIP hydrographic line P16 for (a–b) ACCESS-OM2, (c–d) ACCESS-OM2-025, (e–f) ACCESS-OM2-01, and (g–h) gridded climatologies from WOA13 for the period 1985–2013.

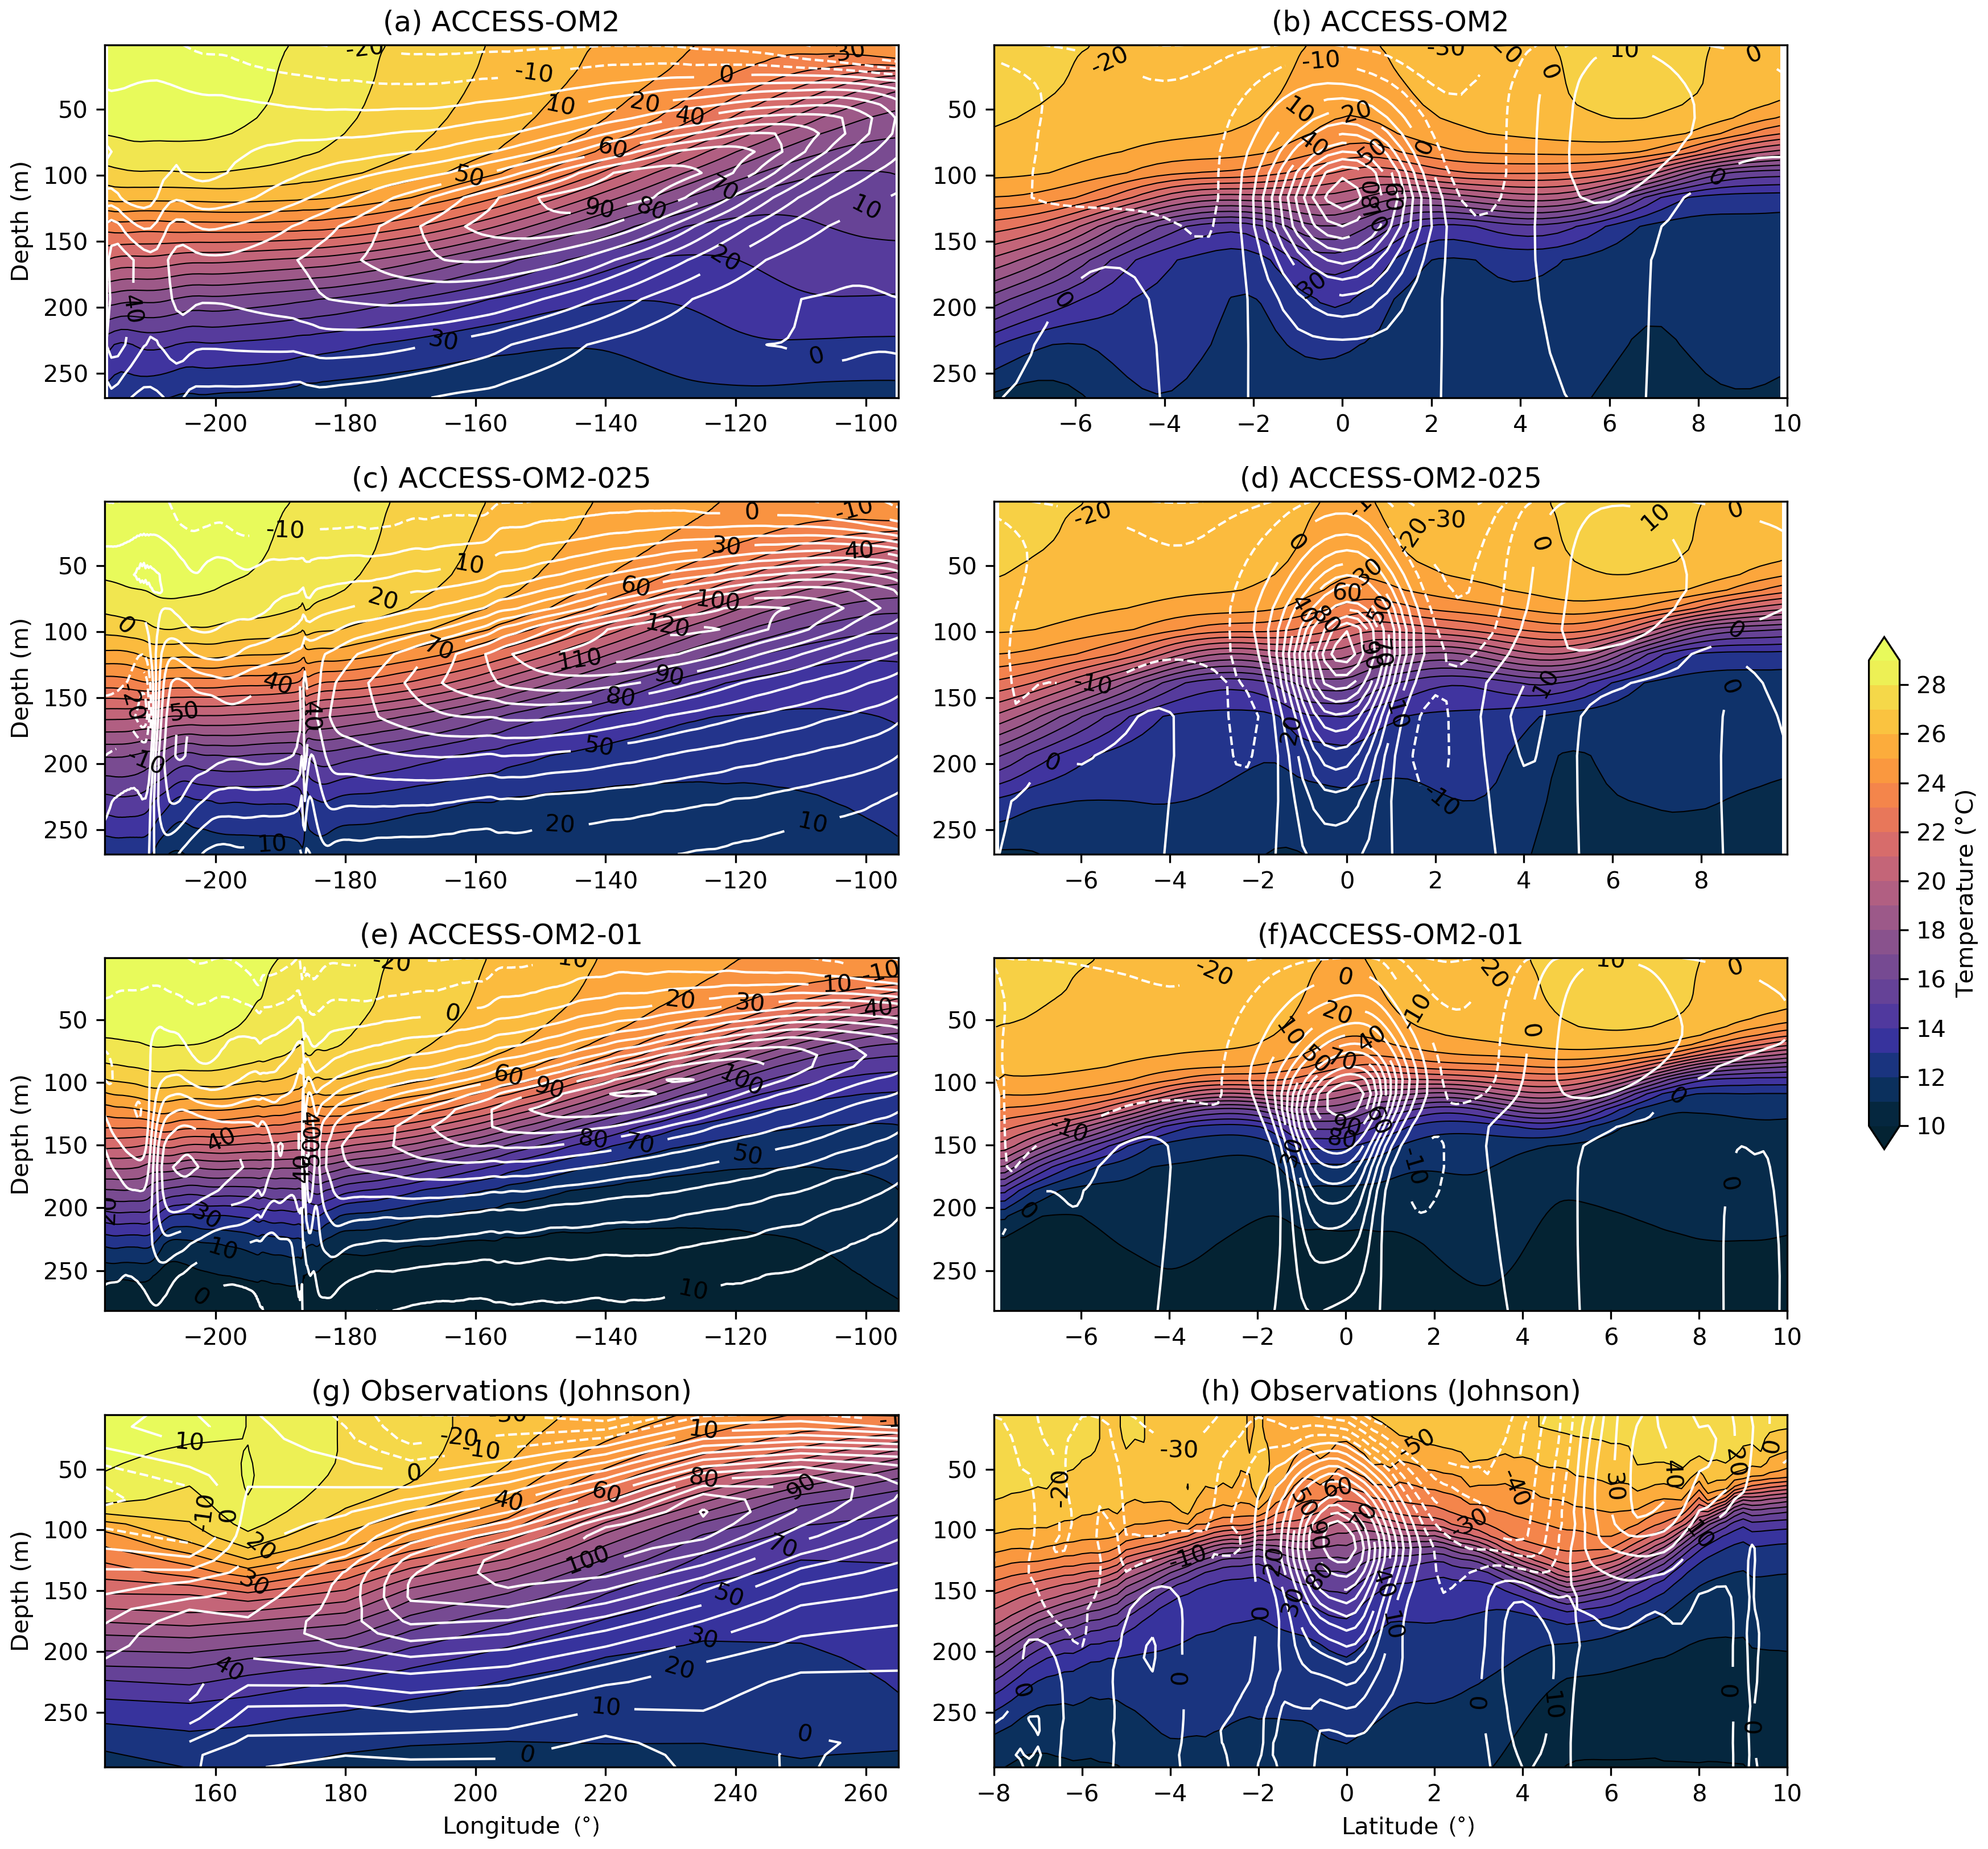
Figure 19: Comparison of temperature (colour and contours every 1 C) and zonal velocity (white contours every 10 cm s−1 with black labels in centimetres per second) along the Equator (left) and at 220 E (right) in the Pacific for (a–b) ACCESS-OM2, (c–d) ACCESS-OM2-025, (e–f) ACCESS-OM2-01, and (g–h) observations (Johnson et al., 2002).

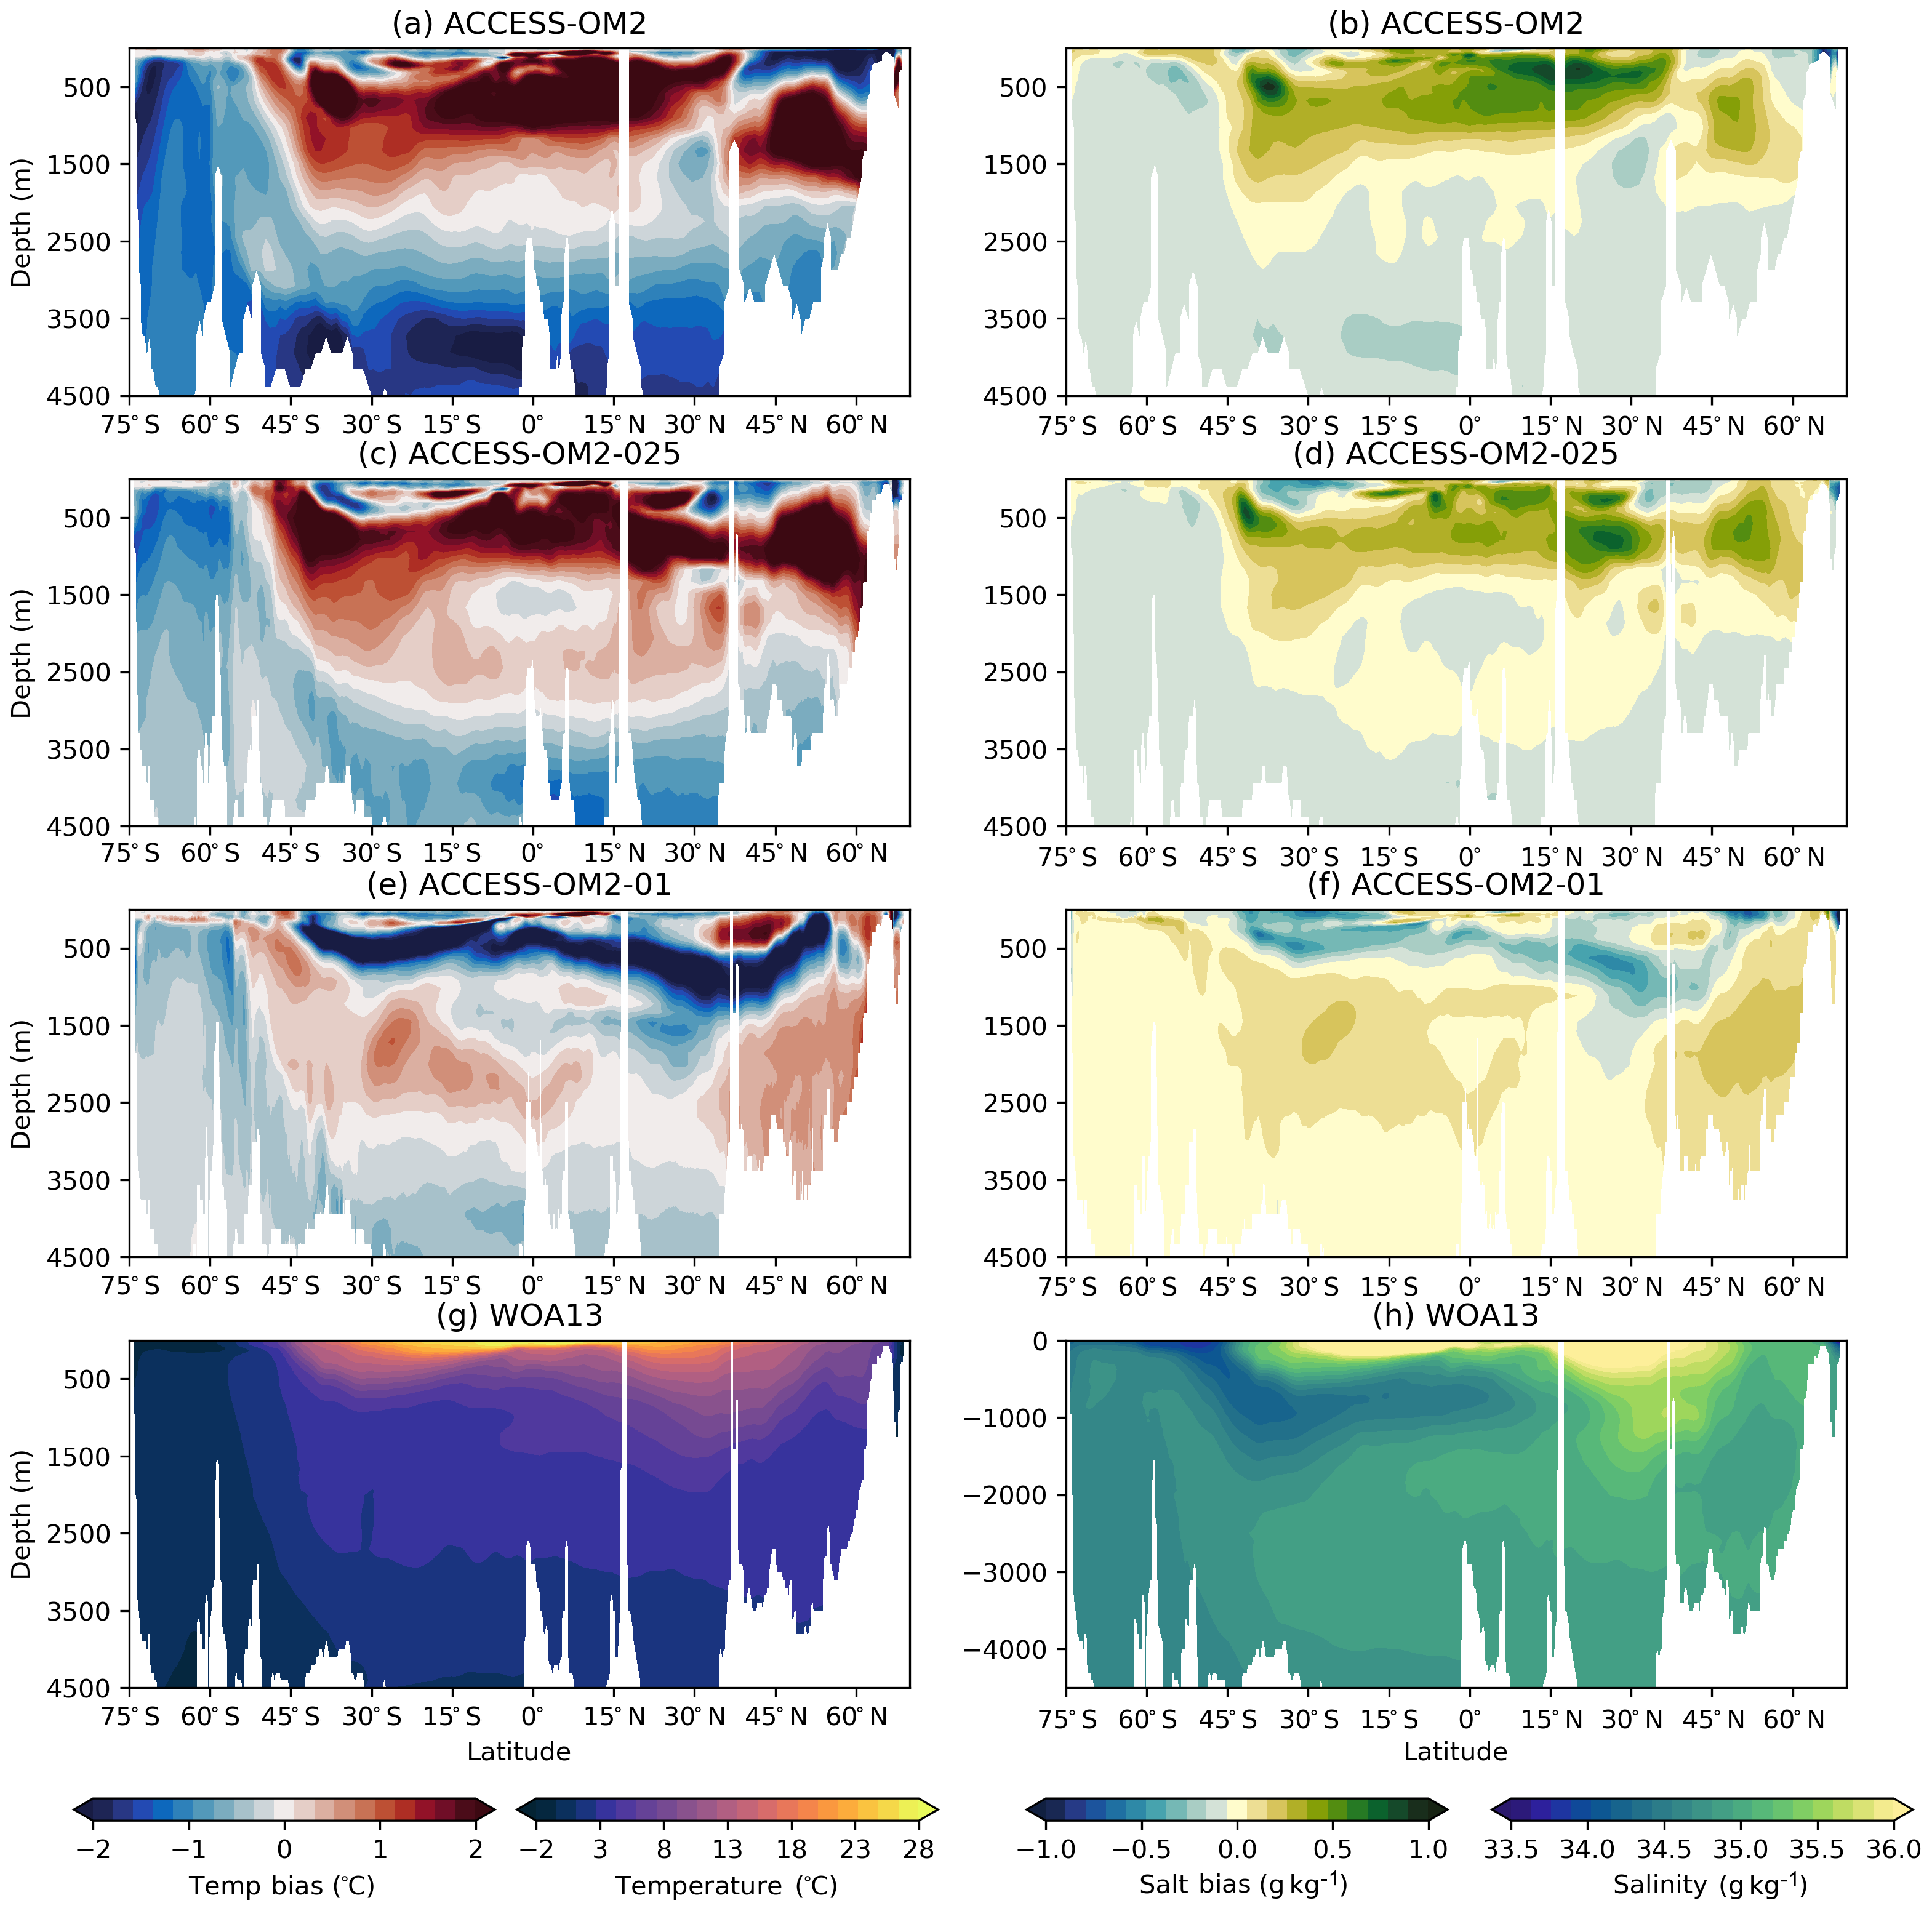
Figure 23: Meridional transects of 1993–2017 mean potential temperature (left panels) and salinity (right panels) in the central Atlantic Ocean, along longitude 25 W, near the WOCE/GO-SHIP hydrographic line A16 for (a–b) ACCESS-OM2, (c–d) ACCESS-OM2-025, (e–f) ACCESS-OM2-01, and (g–h) gridded climatologies from WOA13 for the period 1985–2013.

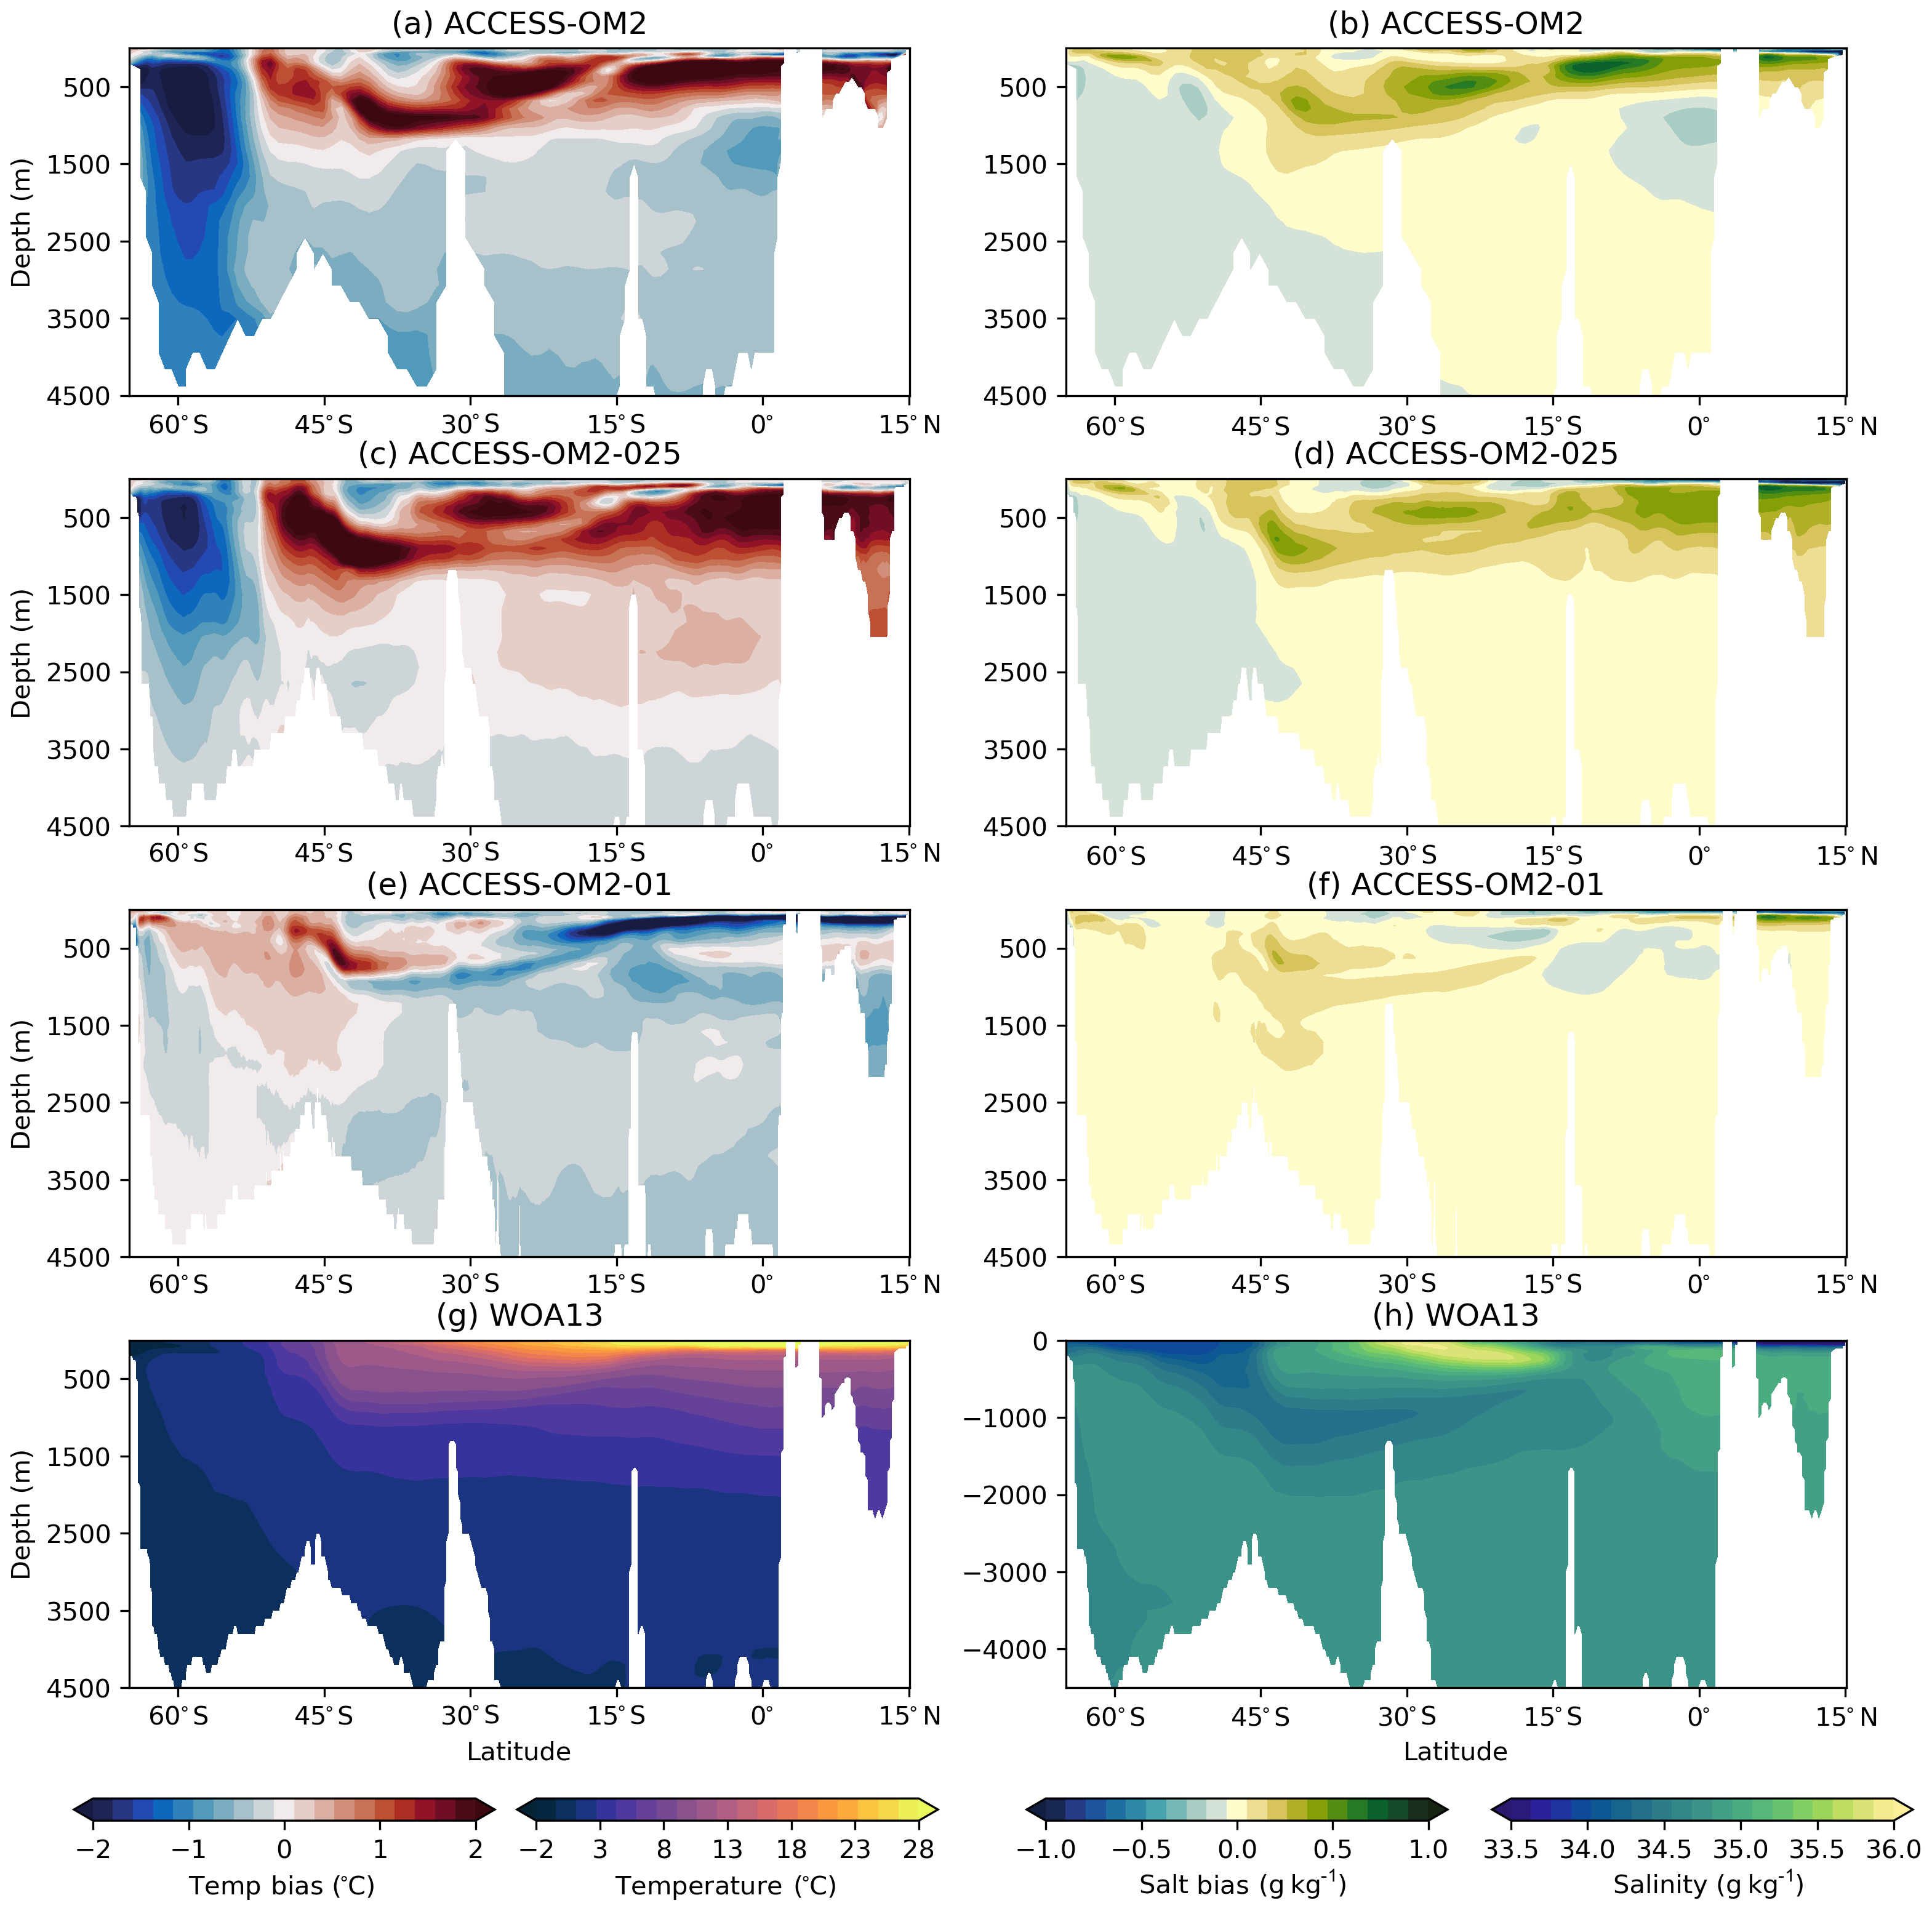
Figure 25: Meridional transects of 1993–2017 mean potential temperature (upper panels) and salinity (lower panels) in the central Indian Ocean, along longitude 95 E, near the WOCE/GO-SHIP hydrographic lines I08 and I09 for (a–b) ACCESS-OM2, (c–d) ACCESS-OM2-025, (e–f) ACCESS-OM2-01, and (g–h) gridded climatologies from WOA13 for the period 1985–2013.

Figure 26: Annual mean depth of the 20 C isotherm (D20). (a) ACCESS-OM2; (b) ACCESS-OM2-025; (c) ACCESS-OM2-01; and (d) WOA13. The black box (50–75 E, 5–10 S) represents the position of the shallowest D20, which is used as a proxy for the thermocline ridge.

aekiss commented 3 years ago

Further investigation is being undertaken here: https://github.com/COSIMA/ACCESS-OM2-Temp-Biases