pzivich
commented
3 years ago
pzivich
commented
3 years ago Hey @beerzyp the plots in Example 2 and 3 seem symmetric because they are forced to by the model. The Cox proportional hazard relies on the proportional hazards assumption. This basically means that the ratio of the hazards are constant over time. If you were to plot the hazard ratio, it would look like a flat line over all Event_at. Another way of saying this is that the hazard ratios are constant over time.
How that shows up in a survival plot is a little different because of the relationship between hazards and survival. The survival curves end up following the pattern exemplified in Example 2. There is some useful documentation on how to check the proportional hazards assumption HERE
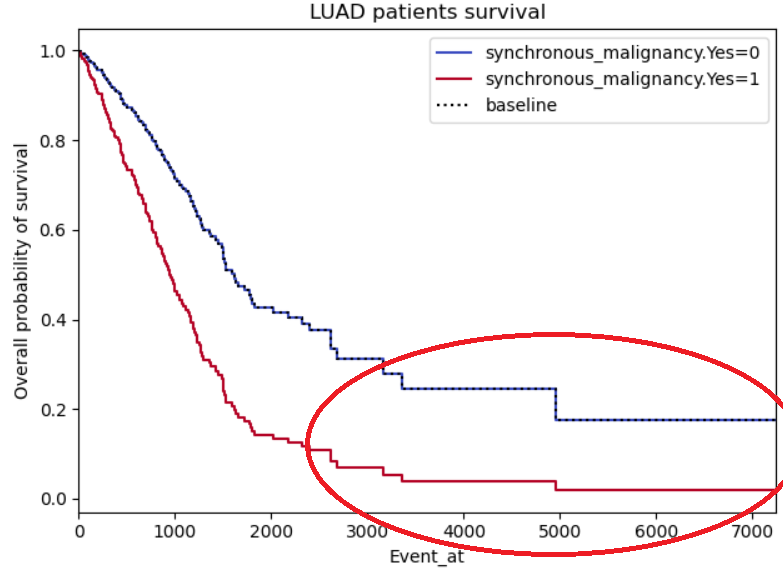
As for example 3, I would guess that there are few individuals with event times past 3500. This is why you have those large jumps.
 beerzyp


 CamDavidsonPilon
Hi and sorry for the long post in advance,
According to the documentation, this function plots the effect of a covariate on the observer's survival. I do understand that the CoxPH model assumes that the log-hazard of an individual is modelled by a linear function of their covariates, however, in some cases the effect of these covariates seems to perfect when plotted. I'll illustrate these with three images below describing the issues I have in my data analysis.
Example 1: This one I'm providing as it looks realistic to me, there is a clear difference in the effect of the covariate when positive or negative.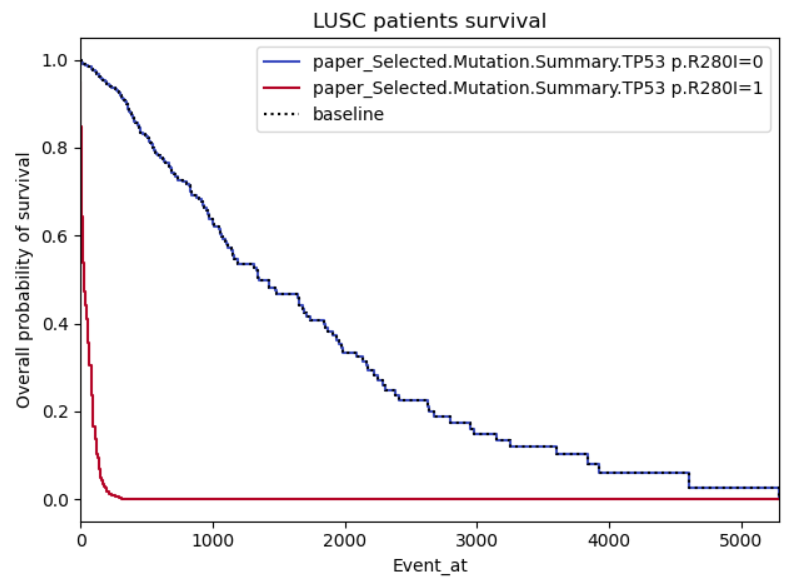
Example 2: This one just looks gimmicky, my concern is firstly there seems to be a perfect relation between the pathologic stage of cancer and the survival. It's logical that higher stages should impact the survival negatively, however, I don't understand why the graph is so symmetric as the survivability of cancer shouldn't be proportional to the patient cancer staging.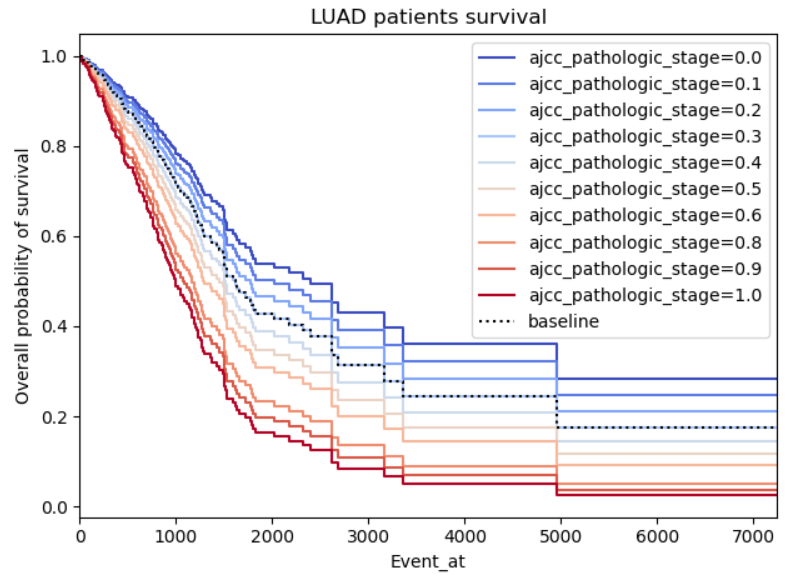
Example 3: Same problems as for example 2, this time with a binary not categorical variable (so I'm less reluctant on disbelieving), however, the curves do seem to symmetric, almost like it's the same curve but with a standard deviation. I also highlighted a region of interest which I don't understand why both curves stabilize (maybe lack of patients in those regions?)