Animation:

Open Cartucho opened 6 years ago
Animation:

Showing area used to calculate the AP:


Many thanks for your work. I think it will be great if we have an option to save images with ground-truth box and prediction box in one folder like this image.

ok cool, so in the result/ folder (the one created after running the code) we could have a result/images/ folder.
We could also add more info to that image, don't you agree? It would be nice to see the confidence of the prediction for example.
What do you think?
yeah that must be cool, wait, i have no "result" folder after run the code, it will be good if we can generate txt file showing the mAP result. and how to generate curve and diagram above ?
i actually want to contribute in this repo but my programming skill is so noob, sorry for that.
For the plots you must install matplotlib:
python -mpip install -U matplotlib
with that, the results folder should show up.
new feature: results are now written to a results.txt file
yeah very cool after i install matplotlib i have a curve and diagram in result folder but i got error says "NameError : name 'xrange' is not defined", if this error have a big matter i'll open new issue. txt file with some details like details per image or IoU details will be awesome.
yes, please open a new issue, I will fix it asap
I'm working on the images, I will be adding: 1) IoU info 2) confidence info
I have tried new feature, it's awesome. I can save the image file with bounding box and prediction box inside it so i can see the error visually.
another feature :
thank you very much for your work and your fast response
I added the IoU and the confidence info, what do you think?

this is so awesome, can't wait for next feature.
New feature added: Plot the number of predicted objects per class!
The new feature is so cool, can we have all the data in diagram or curve in txt files (number of predicted object, number of ground-truth object, precision, recall, etc) ? i just see mAP and AP of each object in txt file.
How should it be organized? Like this?
Btw, should we use .txt or .json? .json would be easier to parse/use from code and smaller.
it's up to you to set the order, i think that order is good enough actually i don't have any experience for .json file, .txt file will be good for me but if you think .json file is better to organize a lot of data, i think that will be nice to use .json.
New feature: Added previously discussed info to the file results/results.txt
Great, I'll try it asap,
====edite=====
i have tried new repo, that's very great, this is all i need. All darkflow user have to use this repo for their project. Thank you so much sir.
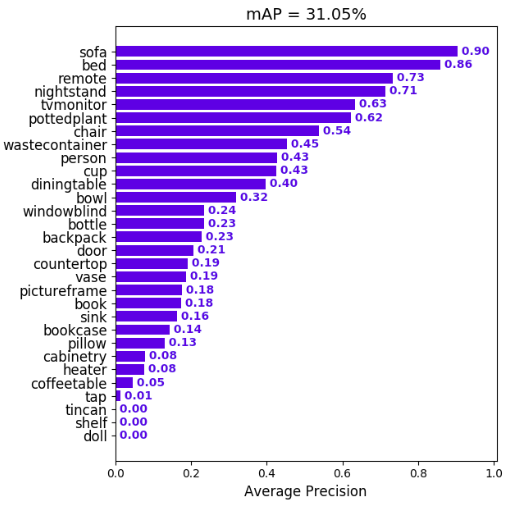
@andikira new feature: Adding values to bars

And info about true and false predictions:

I think I will rotate the plots horizontally to make them easier to read!
@andikira even better now:


Waw that's so awesome, actually i want to make graph like that, that's why i request to insert detail in txt. This update will make my life easier 😆
Thank you @Cartucho 👍 (and ready for new error issue from me haha)
Really liked this repo! May i suggest that you add a yolo conversion for the predicted .txt files aswell ? I got it working by changing 3 lines in the convert_gt_yolo.py code, i can show you if you want :+1:
@JeallyBeans great!
Yeah, could you send the file to me? to.cartucho@gmail.com If you prefer you can also commit it in a PR.
@JeallyBeans Added! Thank you!
NP :+1:
Hey, great work. If I am not wrong, each point in the PR curve represents a confidence threshold at which the Recall has changed. I think it would be a good idea to add the value of the confidence threshold in the plot (so that one can choose the optimal threshold). Or to output such info in another way. What do you think?
Calculating AP for each class given the PR (Precision Recall) curve.
Calculating the mAP: