 andrewheusser
commented
7 years ago
andrewheusser
commented
7 years ago @paxtonfitzpatrick, want to tackle this? we can discuss the specifics
Closed andrewheusser closed 5 years ago
andrewheusser
commented
7 years ago @paxtonfitzpatrick, want to tackle this? we can discuss the specifics
andrewheusser
commented
7 years ago Here is how the user would perform the analysis
import quail
egg = quail.load_example_data()
analyzed_data = quail.analyze(egg, analysis='pnr_matrix')
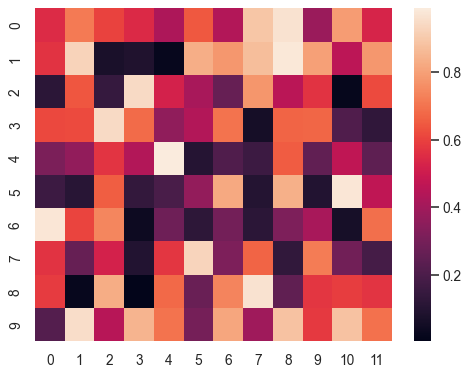
quail.plot(analyzed_data)and this would return a heatmap that looks something like this (but symmetric) where the y axis is encoding position and the x axis will be recall position. The color will represent the probability of recall at that encoding/recall combo. The first row will just be the pfr, the second row will be probability of second recall and so on:
[x] create a new branch called "pnr_matrix" from master
[x] create a new function in the analysis.py file called pnr_matrix_helper. you can put this after pnr_helper in the code. it will look something like this:
def pnr_matrix_helper(pres_slice, rec_slice):
# call pnr_helper internally to get prob of recall for each recall position
return [pnr_helper(pres_slice, rec_slice, n=pos) for pos in range(pres_slice.list_length)]pnr_matrix_helper functionanalyze function below pnrOnce this is working, we'll move onto the plotting!
related to #38, add a new function that creates a matrix version of the pnr for each output position