 meiqimichelle
commented
9 years ago
meiqimichelle
commented
9 years ago Update: received open data version of ONRR maps made with MARS data. @shawnbot and @nickbristow to investigate possibilities.
Closed meiqimichelle closed 9 years ago
meiqimichelle
commented
9 years ago Update: received open data version of ONRR maps made with MARS data. @shawnbot and @nickbristow to investigate possibilities.
meiqimichelle
commented
9 years ago Brainstormed/organized full scope of questions/content that could go into maps. We have some direction now, and will be mocking up ideas.
meiqimichelle
commented
9 years ago Chatted with @shawnbot @nickbristow on next steps given the scope of content and priorities we're working with. Readout:
 shawnbot
commented
9 years ago
shawnbot
commented
9 years ago OK, here's what I've got on Mapbox so far:
meiqimichelle
commented
9 years ago @shawnbot is the pricing the same to use the satellite imagery? I remember when they were starting to role that out, so beautiful that it is here now! I see that they're marketing it as part of Mapbox Data -- do you know if that's an additional app/fee or something?
shawnbot
commented
9 years ago @meiqimichelle yeah, I'm pretty sure that you can just include satellite imagery as or in one of your styles. For reference:
If we could only do basic then we'll need to consider either:
shawnbot
commented
9 years ago So, the possibility that I'm exploring now is:
I like the option of self-hosting because we can do stuff like compositing on the fly with tilelive-blend, and we wouldn't need a database: we could mix and match tile sources in different formats and from different places (one in TileJSON, another stored in mbtiles locally, etc.). The only infrastructure that I'd need some help with is actually provisioning servers and configuring caching appropriately.
meiqimichelle
commented
9 years ago Sounds good to me, although I'm not qualified to assess whether Part 3 makes sense -- I trust you! Let's test it :) My request: let's also take really good notes on our decisions as we go along and plan to write blog post at the end about mapping for gov (or similar). I think we'll learn/can teach a lot here.
 nsinai
commented
9 years ago
nsinai
commented
9 years ago +1! I know it takes extra work to take notes and blog about decisions, but a lot of other federal (and non-federal) agencies will learn from it.
shawnbot
commented
9 years ago Thanks for the nudge, @nsinai! @meiqimichelle, I think we should also consider what data we have access to before we get too far down the tools rabbit hole. Should we start listing our data sources here?
meiqimichelle
commented
9 years ago Sure! This is what we have that is already geo-related (I don't know if it is geo'd in a useful way for our map, but I mean that it is related to a geopoint or shape):
These might be available over time, not sure
These are the datasets that ONRR is preparing now. The latest is that the sales value dataset is complete, but is in QA, and there is a meeting on this on Thursday. If it is not releasable on Thursday then I've asked for a dummy dataset with anonymized and fake data.
Might be a few other things I'm forgetting, but this should get us started!
shawnbot
commented
9 years ago This is great, @meiqimichelle! Do you have URLs for any of these? I'm curious because I want to take a look and see how big/complicated the data is, which will help us evaluate a solution. Also, I'm curious to just start throwing stuff into Mapbox Studio and seeing what comes out :)
meiqimichelle
commented
9 years ago @shawnbot I updated my comment above to include URLs as I know them. For the boundary info, those would be through Jason's Esri demo for the basins; through nationalmap.gov or similar for the Fed-non-Fed land, and perhaps also the boundaries for offshore regions. The offshore stuff is also available through the BOEM map portal. Some is already on our current map, too.
shawnbot
commented
9 years ago :+1: thanks @meiqimichelle
meiqimichelle
commented
9 years ago I've worked on some initial content structure in this Google doc. Could help inform what you're playing with on your end.
shawnbot
commented
9 years ago For future reference, last week I started work on some of the maps in the eiti-maps repository.
meiqimichelle
commented
9 years ago Moving some of the discussion that happened in the above-referenced Google doc here. In the doc, we organized content blocks by topics that we think we should answer for users on our site. @shawnbot decided to tackle the following topic first in order to start understanding the available geo-referenced data for the data portal:
Topic: Where is extraction happening?
Questions to answer:
Potential design solution: Story map
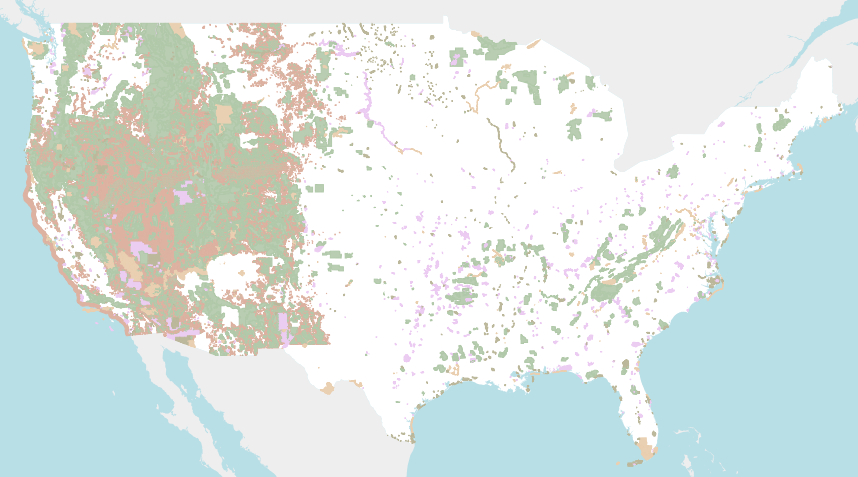
@shawnbot has started turning data from ONRR and data surfaced by Deloitte through the contextual narrative research process into web-accessible geo formats in the eiti-maps repository. So far, this includes a Federal lands map:
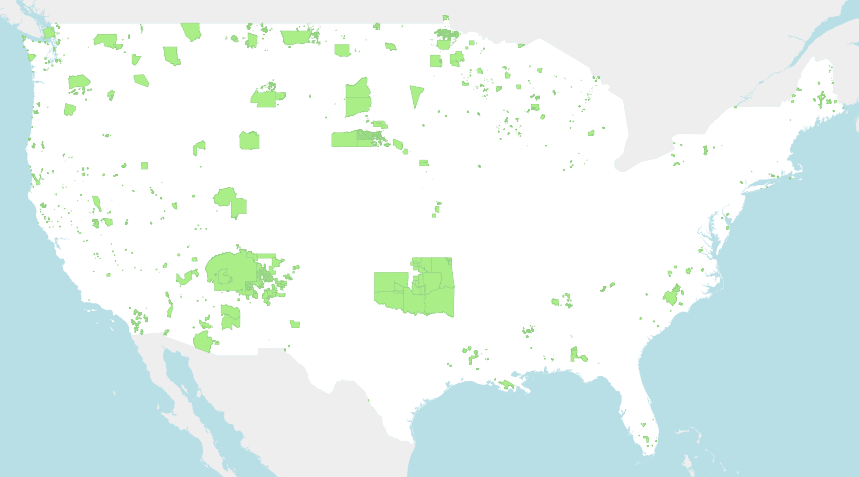
...and a Tribal areas map:
meiqimichelle
commented
9 years ago We are moving to a data display without tiles. We feel that this might better convey the data, and if we need some background for reference (such as the Fed/non-Fed land above), an image (not tiles) might work better for our usecase.
However, after discussion in 18F, we are moving forward with requesting the purchase of one Mapbox account for 18F prototyping use.
@shawnbot has ideas around maps and data, with EITI as a case, and how we're basically redesigning the entire site around geography, what the implications are, etc. It exists in idea form and has gotten :+1: from 18F comms.
Work --> #493
Pending: 18F team will get access to basin-based map made in Esri Storymap platform at ONRR and investigate best way to work with that data. cc/ @shawnbot
Possibilities:
Considerations: