Open sunaynagoel opened 4 years ago
First step is to check through the codebook to make sure it exists. You can see that the question was moved from the Decennial Census long-form to the American Community Survey starting in 2010:
You have two zipped data directories. One contains variables that come from the census short form that represent the full population (FULL). And the other are variables drawn from the long form, or the ACS (SAMPLE). Since Median Home Value is drawn from ACS in 2010 it should be in the sample folder.
If you look there is a variable called mhmval12.
The 12 is because they created a weighted sample of responses from 2008 to 2012 in order to have a large enough sample to estimate values at the tract level.
@lecy Thank you for your reply. I wanted to make sure before proceeding. This helps a lot.
Hi, it looks like the link to the index construction example is not working. When you click on it it just relinks you to the top of the schedule page. Thanks!
I noticed the same issue as well.
@sunaynagoel and @meliapetersen thank you for flagging! I believe the index construction was meant to link you to the report from the Economic Innovation Group. Alternatively, you may find footnote #2 on page 53 of this report to be useful as well.
@lecy @cenuno I have a few questions concerning part 1 of Lab 02:
1) Should we have a total of at least 9 variables (3 for each of the 3 instruments)?
2) I know that the variables for each instrument should not measure the same thing, but is it okay if they come from the same category?
Ex. Can we have Median HH income, total, % with 4-year college degree or more, and % owner-occupied units as an instrument if it produces an appropriate Cronbach score?
-Courtney
@castower
Hey Courtney,
Yes, you should have at least 9 variables (at least 3 for each of the 3 instruments).
What do you mean by category? At the moment, your example instrument composed on Median HH income, % with 4-year college degree or more, and % owner-occupied units as an instrument is valid (assuming it achieves a Cronbach’s alpha reliability score of at least 0.7).
Another question I have for you is what is the total
column you reference?
@castower
Hey Courtney,
- Yes, you should have at least 9 variables (at least 3 for each of the 3 instruments).
- What do you mean by category? At the moment, your example instrument composed on Median HH income, % with 4-year college degree or more, and % owner-occupied units as an instrument is valid (assuming it achieves a Cronbach’s alpha reliability score of at least 0.7).
Another question I have for you is what is the
total
column you reference?
Thanks @cenuno I meant for each category within the codebook categories like Housing, Age, and Marital Status and Socioeconomic status. I wasn't sure if the instructions meant that we could only pick one from each of these.
Similarly, the total was just how many individual variables we should pick.
Thanks again!
@cenuno @lecy I am trying to collect data for constructing the instruments for the LAB. I have couple of questions so far.
Thanks ~Nina
@sunaynagoel Hi Nina,
A few tracts of your choice that you feel represent your community will be good. I would recommend using the data from harmonized_census_tracts/ltdb_std_all_sample/ltdb_std_2000_sample.csv
to filter the census tracts by county
and state
.
I would use data available to you only in the 2000 since this lab only requires you to investigate the initial conditions of communities in 2000.
Respectfully,
Cristian
Hello, I am hoping someone can give me tips on how they dropped the rural tracts?
I am using the harmonized_census_tracts/ltdb_std_all_sample/ltdb_std_2000_sample.csv and am aware the available variable for total population is popxxsf3- but I am not sure how to identify which tracts would be considered rural.
Thanks!
I have the same question as well.
Hello, I am hoping someone can give me tips on how they dropped the rural tracts?
I am using the harmonized_census_tracts/ltdb_std_all_sample/ltdb_std_2000_sample.csv and am aware the available variable for total population is popxxsf3- but I am not sure how to identify which tracts would be considered rural.
Thanks! @Jigarci3 I think we can filter out the variable popxxsf3 for population greater than or equal to 50000. Which should give us only urban tract.
Hello, I am hoping someone can give me tips on how they dropped the rural tracts? I am using the harmonized_census_tracts/ltdb_std_all_sample/ltdb_std_2000_sample.csv and am aware the available variable for total population is popxxsf3- but I am not sure how to identify which tracts would be considered rural. Thanks! @Jigarci3 I think we can filter out the variable popxxsf3 for population greater than or equal to 50000. Which should give us only urban tract.
@sunaynagoel I had thought the same thing but found that no tracts contain a population that high so my filter would return with no tracts. Did you have a different outcome?
@Jigarci3 I show about 17822 rows of results. Here is my code
dat_2000_urban <- dat_2000 %>%
filter (pop00sf3 > "50000" | pop00sf3 == "50000")
@sunaynagoel @Jigarci3
This was one of the challenge questions in this lab. It is a reference back to one of the steps in creating Dorling cartograms in CPP 529.
You don't have enough information to differentiate urban from rural in this dataset, so you need to add meta-data from the Metro Statistical Area files (MSA files).
If you recall, to create your Dorling cartogram you have to identify counties that belong to MSAs, then create a list of the counties for your particular MSA and download Census tracts data for those counties specifically.
Alternatively, you can use the crosswalk to create a list of ALL counties that belong to MSAs (urban counties) and the rest can be coded as rural.
The file here is a bit more thorough than the one you used on the lab:
From:
https://data.nber.org/data/cbsa-msa-fips-ssa-county-crosswalk.html
Combined MSA CBSA FIPS County Crosswalk 2005, 2011-2017: CSV DOWNLOAD
And note in the data dictionary for CBSA Name (copied below): "blanks are rural"
Here is some code to get you started:
URL <- "https://data.nber.org/cbsa-msa-fips-ssa-county-crosswalk/cbsatocountycrosswalk.csv"
crosswalk <- read.csv( URL, stringsAsFactors=F )
# all metro areas in the country
sort( unique( crosswalk$cbsaname ) )
crosswalk$urban <- ifelse( crosswalk$cbsaname == "", "rural", "urban" )
keep.these <- c( "countyname","state","fipscounty",
"msa","msaname",
"cbsa","cbsaname",
"urban" )
cw <- dplyr::select( crosswalk, keep.these )
# merge into census data by county FIPS
# watch the leading zeros problem
And the data dictionary for the file:
_dta:
1. cbsatocountycrosswalk2005 set up by Jean Roth , jroth@nber.org , 20 Dec 2016
2. Source: fr05_cbsa_msa_xwalk_pub.txt
3. NBER URL: http://www.nber.org/data/cbsa-msa-fips-ssa-county-crosswalk.html
4. Source Page: http://www.cms.gov/Medicare/Medicare-Fee-for-Service-Payment/AcuteInpatientPPS/Acute-Inpatient-Files-for-Download-Items/CMS022637.html
5. Source File URL: http://www.cms.gov/Medicare/Medicare-Fee-for-Service-Payment/AcuteInpatientPPS/Downloads/fr05_cbsa_msa_xwalk_pub.zip
6. by Jean Roth , jroth@nber.org , 28 Nov 2016
ssacounty:
1. Los Angeles FIPS 06037 can have two SSA county codes: 05210 and 05200
obs: 3,293
vars: 21 20 Dec 2016 11:41
size: 757,390 (_dta has notes)
------------------------------------------------------------------------------------------------------------------------------------------------------------------------
storage display value
variable name type format label variable label
------------------------------------------------------------------------------------------------------------------------------------------------------------------------
countyname str26 %26s County Name
state str2 %9s State
ssacounty str5 %9s * SSA County Code
fipscounty str5 %9s FIPS County Code
msa str6 %9s Old MSA
l str1 %9s Lugar
msaname str48 %48s Old MSA Name
cbsa str5 %9s CBSA - if blank then rural area (set equal to first 2 digits of ssa code)
cbsaname str50 %50s CBSA Name
cbsaold long %12.0g (Blanks are Rural)
cbsanameold str42 %42s (Blanks are Rural)
ssast str2 %9s SSA State code
fipst str2 %9s FIPS State code
y2005 float %9.0g Present in 2005 source file
y2011 float %9.0g Present in 2011 source file
y2012 float %9.0g Present in 2012 source file
y2013 float %9.0g Present in 2013 source file
y2014 float %9.0g Present in 2014 source file
y2015 float %9.0g Present in 2015 source file
y2016 float %9.0g Present in 2016 source file
y2017 float %9.0g Present in 2017 source file
* indicated variables have notes
------------------------------------------------------------------------------------------------------------------------------------------------------------------------
Sorted by: fipscounty ssacounty
https://data.nber.org/data/cbsa-msa-fips-ssa-county-crosswalk.html
@lecy @cenuno I am having problem merging two datasets. Here are my steps.
When I run my step 4, I get a new data frame but with same number of observation as sample_2000 dataset. I am not sure if the merge is deleting any uncommon entires. I tried merge (), and inner.join(). I also tried renaming the key column so both the data set have same name variable to merge.
Here is part of my code.
sort( unique( crosswalk$cbsaname ) )
crosswalk$urban <- ifelse( crosswalk$cbsaname == "", "rural", "urban" )
keep.these <- c( "countyname","state","fipscounty",
"msa","msaname",
"cbsa","cbsaname",
"urban" )
cw <- dplyr::select( crosswalk, keep.these )
cw_urban <- cw %>%
filter (urban == "urban")
dat_2000_urban <- merge( dat_2000, cw_urban, by.x = "cbsa10", by.y = "cbsa")
dat_2000_urban
Thanks Nina
I marked up some notes on scale development drawing on the readings and including R code. Hopefully this helps clarify some of the steps:
https://ds4ps.org/cpp-528-spr-2020/labs/lab-02-tutorial.html
PLEASE NOTE!
Some variables in the LTDB code missing values as -999. This was a common practice in the past, but is a VERY BAD practice because if you are not careful you don't realize your numeric vector contains these values and you might unintentionally include them in your analysis. They will badly skew your measure and result in very poor results.
Make sure to recode all -999's to NA prior to analysis.
@sunaynagoel I would need to see how you created your dat_2000 file because I'm getting something different here when I follow your code:
dat_2000_urban <- merge( dat_2000, cw_urban, by.x = "cbsa10", by.y = "cbsa")
> nrow( dat )
[1] 72693
> nrow( dat_2000_urban )
[1] 217771
Do you see the problem? This is a common mistake with merges, but it causes big issues because you blew up your data set from 72,000 census tracts to 217,000 tracts. You have created duplicate rows in your file.
The crosswalk is organized by county. There are just over 3,000 counties in the US (plus some extra for Puerto Rico). But only 388 "cities" (core based statistical areas):
> nrow( cw )
[1] 3293
> length( unique( cw$fipscounty ) )
[1] 3292
> length( unique( cw$cbsaname ) )
[1] 388
If you want to merge by CBSA ID you need to create a CBSA crosswalk so you are not duplicating rows:
> cbsa <-
+ cw %>%
+ filter( urban == "urban" ) %>%
+ select( cbsa, urban )
> cbsa <- unique( cbsa )
> nrow( cbsa )
[1] 387
You can use that crosswalk for the merge. But you might notice you have already filtered out all rural areas, so instead you can use this set of CBSA ids to select your appropriate rows:
cbsa.id <- cbsa$cbsa
keep.these <- dat_2000$cbsa10 %in% cbsa.id
dat_2000_urban <- filter( dat_2000, keep.these )
The bigger problem is you can't use this approach to add urban/rural attributes to the sample file because it does not contain the CBSA variable. For these if you need to merge by County FIPS you can construct the FIPS code by combining state and county codes from those files.
The annoying thing is that leading zeros are dropped, so county 02-075 will show up as 2-75 if you simply paste the state FIPS and county FIPS. Instead you need to add the leading zeros back. Something like this:
st.fips <- state + 10000
st.fips <- substr( st.fips, 4, 5 ) # extract last two numbers
ct.fips <- county + 10000
ct.fips <- substr( ct.fips, 3, 5 ) # extract last three numbers
fips <- paste0( st.fips, ct.fips )
That should match the fipscounty variable in the crosswalk, though you might need to add a leading zero back or drop the leading zero from the other now.
I will sometimes create a new FIPS with the format:
id-99-999 # county
id-99-999-999999 # tract
Since it has a string you will never lose a leading zero, and it's easier to parse state, county, and tract FIPS with some delimiter in the string.
@sunaynagoel I would need to see how you created your dat_2000 file because I'm getting something different here when I follow your code:
dat_2000_urban <- merge( dat_2000, cw_urban, by.x = "cbsa10", by.y = "cbsa") > nrow( dat ) [1] 72693 > nrow( dat_2000_urban ) [1] 217771
Do you see the problem? This is a common mistake with merges, but it causes big issues because you blew up your data set from 72,000 census tracts to 217,000 tracts. You have created duplicate rows in your file.
The crosswalk is organized by county. There are just over 3,000 counties in the US (plus some extra for Puerto Rico). But only 388 "cities" (core based statistical areas):
> nrow( cw ) [1] 3293 > length( unique( cw$fipscounty ) ) [1] 3292 > length( unique( cw$cbsaname ) ) [1] 388
If you want to merge by CBSA ID you need to create a CBSA crosswalk so you are not duplicating rows:
> cbsa <- + cw %>% + filter( urban == "urban" ) %>% + select( cbsa, urban ) > cbsa <- unique( cbsa ) > nrow( cbsa ) [1] 387
You can use that crosswalk for the merge. But you might notice you have already filtered out all rural areas, so instead you can use this set of CBSA ids to select your appropriate rows:
cbsa.id <- cbsa$cbsa keep.these <- dat_2000$cbsa10 %in% cbsa.id dat_2000_urban <- filter( dat_2000, keep.these )
The bigger problem is you can't use this approach to add urban/rural attributes to the sample file because it does not contain the CBSA variable. For these if you need to merge by County FIPS you can construct the FIPS code by combining state and county codes from those files.
The annoying thing is that leading zeros are dropped, so county 02-075 will show up as 2-75 if you simply paste the state FIPS and county FIPS. Instead you need to add the leading zeros back. Something like this:
st.fips <- state + 10000 st.fips <- substr( st.fips, 4, 5 ) # extract last two numbers ct.fips <- county + 10000 ct.fips <- substr( ct.fips, 3, 5 ) # extract last three numbers fips <- paste0( st.fips, ct.fips )
That should match the fipscounty variable in the crosswalk, though you might need to add a leading zero back or drop the leading zero from the other now.
I will sometimes create a new FIPS with the format:
id-99-999 # county id-99-999-999999 # tract
Since it has a string you will never lose a leading zero, and it's easier to parse state, county, and tract FIPS with some delimiter in the string.
@lecy Thank you for the explanation. I don't fully understand it yet but I can see the problem. I had an office hour tutoring with @cenuno this evening, he helped me understand this problem as well. I was able to get the desired results by filtering and merging the data sets following the steps you explained here and by following the steps @cenuno Christian showed earlier this evening. It was very helpful. I am still going to try and create unique Tractid so I know how to do it next time. I appreciate the help. Thanks.
The good news is Census data is a mess. If you can work with Census data you can work with any data!
The point of this question was to force you to deal with data at two levels - census tracts and counties (metro areas being comprised of lists of counties). Merge details are important when combining data that is organized at different units of analysis. Lots of ways it can go wrong.
Welcome to real world data people problems :-)
@meliapetersen I added some notes on index construction if helpful:
https://ds4ps.org/cpp-528-spr-2020/labs/lab-02-tutorial.html
When I try to replace -999 with NA in the data, it goes in an endless loop. Here is my code.
dat_2000 <- dat_2000 %>%
replace_with_na_all(condition = ~.x == -999) %>%
dat_2000
@sunaynagoel since you're already using pipes - %>%
, here is a tidyverse
solution that uses the mutate_all()
function:
# load necessary packages
library(tidyverse)
# replace all values of 3 with NA
iris %>%
# cast the data.frame to a tibble
# note: this is similar to a data.frame, except it prints nicer in the R console
as_tibble() %>%
# note: the anonymous function is used here that can be read as follows:
# for each element (i), test if it is equal to 3
# if true, replace with NA; else, leave the value (i) as is
# this logic is then applied to every column in the data frame iris
mutate_all(function(i) ifelse(i == 3, NA, i))
In your case, you could swap ifelse(i == 3, NA, i)
to ifelse(i == -999, NA, i)
within the mutate_all()
function to replace every -999
value with NA
. See more on as_tibble()
here.
Generally speaking, when you are debugging code, it is very easy to stick with the data at hand. However, I find that it can often get in the way of figuring out a solution to the problem at hand.
That's where using R's built in datasets - such as iris
, starwars
, etc. - are super useful. Here, you can use smaller datasets to test the logic that is troubling you with your original data set (dat_2000
).
In my example above, it would be impossible for me to recreate dat_2000
because I don't have a copy of your code via GitHub. But with a reproducible example, such as the one above, folks are able to share code without worrying about being able to reproduce objects.
Whenever possible, creating a reproducible example is the best way to get help from others.
@sunaynagoel since you're already using pipes -
%>%
, here is atidyverse
solution that uses themutate_all()
function:# replace all values of 3 with NA iris %>% # cast the data.frame to a tibble # note: this is similar to a data.frame, except it prints nicer in the R console as_tibble() %>% # note: the anonymous function is used here that can be read as follows: # for each element (i), test if it is equal to 3 # if true, replace with NA; else, leave the value (i) as is # this logic is then applied to every column in the data frame iris mutate_all(function(i) ifelse(i == 3, NA, i))
In your case, you could swap
ifelse(i == 3, NA, i)
toifelse(i == -999, NA, i)
within themutate_all()
function to replace every-999
value withNA
. See more onas_tibble()
here.Reproducible Examples Are Great for Debugging
Generally speaking, when you are debugging code, it is very easy to stick with the data at hand. However, I find that it can often get in the way of figuring out a solution to the problem at hand.
That's where using R's built in datasets - such as
iris
,starwars
, etc. - are super useful. Here, you can use smaller datasets to test the logic that is troubling you with your original data set (dat_2000
).In my example above, it would be impossible for me to recreate
dat_2000
because I don't have a copy of your code via GitHub. But with a reproducible example, such as the one above, folks are able to share code without worrying about being able to reproduce objects.Whenever possible, creating a reproducible example is the best way to get help from others.
Thank you @cenuno
Hello @lecy @cenuno
Is there a way to check and see if the -999 exists in the data set? I only seem to have 'NA's in mine and do not see any instances of '-999', but I want to check and make sure.
Thanks! Courtney
@castower Hi Courtney,
Yes, we use the same sort of tidyverse
logic I used with Nina's original question, this time using summarize_all()
function, coupled with the gather()
function to return a data frame that has one row per column_name
that contains at least one element with the value of interest.
# load necessary packages
library(tidyverse)
# inspect for the existence of a particular value
iris %>%
# cast the data.frame to a tibble
# note: this is similar to a data.frame,
# except it prints nicer in the R console
as_tibble() %>%
# note: the anonymous function is used here can be read as follows:
# for each variable (i), test if any element
# in that variable (i) is equal to 3
# if true, return TRUE; else, return FALSE
summarise_all(function(i) any(i == 3)) %>%
# note: reshape the tibble from wide
# (1x5, one row with one column per column name)
# to long
# (5x2, one row per column name)
gather(key = "column_name", value = "value_of_3_flag") %>%
# only return rows where the flag column is TRUE
# note: these will be columns that contained at least
# one element that was equal to 3
filter(value_of_3_flag)
This return the following:
# A tibble: 2 x 2
column_name value_of_3_flag
<chr> <lgl>
1 Sepal.Width TRUE
2 Petal.Length TRUE
In your case, you can swap out summarise_all(function(i) any(i == 3))
with summarise_all(function(i) any(i == -999))
to replicate this logic for your use case. In your case, you should theoretically have zero rows returned given that you replaced all values of -999
with NA
.
@cenuno thanks so much!
Hello @cenuno , I'm currently working on standardizing all of my variables and looking at the codebook, it appears that 'prof00' is the same as 'pprofxx', but the numbers are four digits long:
> head(data_urban$prof00)
[1] 547.0000 417.0000 754.0000 279.0000 632.6072 556.3555
Would it be appropriate to divide these by 100? As follows?
head((data_urban$prof00)/100)
[1] 5.470000 4.170000 7.540000 2.790000 6.326072 5.563555
Thanks! Courtney
Edit: I forgot to add, in the codebook, the 'pprofxx' variable is identified as '% professional employees' so I'm assuming they should be a percentage, but there is only one p for 'prof00' in the 2000s dataset.
I'll jump in here because I've been wading through the documentation for the LTDB.
What are the summary stats on prof00? The range specifically?
I would worry they are counts and not proportions if they do not include the preceding "p". It seems odd they would have values above 100 if it were a percentage.
If you read the documentation on the website it says:
LTDB Standard data set: We now offer two standard data sets. The first is for full count variables. It includes the key variables from Census 2010 (race and Hispanic origin, age by race and Hispanic origin, household composition, and housing occupancy and tenure), with comparable variables from the censuses in 1970-2000 and adjusted to 2010 boundaries. The file only includes the population counts for every variable; we leave it to the user to compute percentages or other constructed variables. The second is for sample count variables, characteristics such as median income and occupation. These sample variables for 1970 through 2000 are from the one-in-six decennial censuses, called "long form data." For 2010 we rely on the American Community Survey (ACS 2008-2012), which pools ACS samples across five years, with 2010 as the midpoint.
Is that from the full or sample?
https://s4.ad.brown.edu/projects/diversity/Researcher/LTBDDload/DataList.aspx
@castower Hey Courtney,
Great question. Please do not divide by 100.
This is a perfect example of how the documentation is flawed in that there is no percentage of professional employees column in the data itself, but does gives us a way to manually create it ourselves.
From pages 23-24 and 47,
we get the following formula:
pprofXX = profXX / empclfXX
where pprofXX
is the percentage of professional employees, profXX
is the number professional employees (by occupations) and empclfXX
is the number employed persons 16 years and over.
As is common in the census, the denominator - in this case empclfXX
- is constantly changing based on the numerator in question. This is a common "gotcha" in the sense that you should always be aware which universe of people make up your denominator with each variable.
Never assume the default is all people or total population. This is something I'm very happy you pointed out!
@lecy
It comes from the sample data.
Here are the summary statistics:
> summary(data_urban$prof00)
Min. 1st Qu. Median Mean 3rd Qu. Max.
0.0 292.9 515.0 602.9 824.8 3524.7
@cenuno Thank you! I did not see that. I will recalculate.
@cenuno
I've been able to create two other significant instruments, but now that I'm working on my instrument with mhmval
, I can't seem to find any of the variables that have a high correlation with it. I suspect that this may be due to it being a large number (hundreds of thousands) compared to others, but even after I scaled it, it still keeps producing very small alpha scores.
Any suggestions for variables I should consider? I have tried median rent, per capita income, owner-occupied units, and household income.
-Courtney
Hi, I feel like I'm having a small issue that I just cannot get past. I'm trying to do a basic outer join with the data and I'm getting this error:
Error:
bycan't contain join column
tractidwhich is missing from LHS
This is my code for the join:
dplyr::full_join(dat_2000, dat_2010, by = "tractid")
And this is how I have mutated the data:
dat_2000 <- read.csv("/Users/mbpeter4/Desktop/CPP 528/Week 2/Lab 2/ltdb_std_2000_sample.csv")
dat_2010 <- read.csv("/Users/mbpeter4/Desktop/CPP 528/Week 2/Lab 2/ltdb_std_2010_sample.csv")
dat_2000 %>%
rename( tractid = TRTID10)
I feel like I must just be missing something really simple.
Thank you :)
@meliapetersen did you try putting tractid and TRTID10 in quotations?
@cenuno
I've been able to create two other significant instruments, but now that I'm working on my instrument with
mhmval
, I can't seem to find any of the variables that have a high correlation with it. I suspect that this may be due to it being a large number (hundreds of thousands) compared to others, but even after I scaled it, it still keeps producing very small alpha scores.Any suggestions for variables I should consider? I have tried median rent, per capita income, owner-occupied units, and household income.
-Courtney
@castower Hi Courtney,
I would suggest the following columns:
incp00
: per capita incomehinc00
: median HH income, totalhincw00
: median HH income, whitescolXX
: persons with at least a four year college degree@meliapetersen did you try putting tractid and TRTID10 in quotations?
So I ended up changing TRTID10 to tractid so that I could join the data by track IDs so they should be the same.
Hi, I feel like I'm having a small issue that I just cannot get past. I'm trying to do a basic outer join with the data and I'm getting this error:
Error:
bycan't contain join column
tractidwhich is missing from LHS
This is my code for the join:
dplyr::full_join(dat_2000, dat_2010, by = "tractid")
And this is how I have mutated the data:
dat_2000 <- read.csv("/Users/mbpeter4/Desktop/CPP 528/Week 2/Lab 2/ltdb_std_2000_sample.csv") dat_2010 <- read.csv("/Users/mbpeter4/Desktop/CPP 528/Week 2/Lab 2/ltdb_std_2010_sample.csv")
dat_2000 %>% rename( tractid = TRTID10)
I feel like I must just be missing something really simple.
Thank you :)
@meliapeterson Hi Melia,
I can't prove this, but I think somewhere in your R code you may have overwritten dat_2000
such that the column name tractid
was somehow erased/renamed to something else. Either way, your logic inside the full_join()
function looks right.
In any case, I'm showing an example code down below that performs the full_join()
without renaming any columns:
# load necessary packages ----
library(here)
library(tidyverse)
# load necessary data ----
dat_2000 <-
read_csv(here("data/raw/harmonized_census_tracts/ltdb_std_all_sample/ltdb_std_2000_sample.csv")) %>%
# cast all column names to lower case
rename_all(str_to_lower)
dat_2010 <-
read_csv(here("data/raw/harmonized_census_tracts/ltdb_std_all_sample/ltdb_std_2010_sample.csv")) %>%
# cast all column names to lower case
rename_all(str_to_lower)
# perform full join such that we return all rows and all columns
# from both x and y
dat_2000_2010 <-
dat_2000 %>%
full_join(dat_2010,
# the keys can be spelled differently
by = c("trtid10" = "tractid"))
# check dimensions
dim(dat_2000_2010) # [1] 73076 252
# end of script #
@cenuno I'm not sure what I'm doing wrong, but none of the variables are correlated with mhmval00:
# Create housing data set
houses <- data_urban %>%
select(mhmval00, col00, incpc00, hincw00, hinc00)
cor(houses)
mhmval00 col00 incpc00 hincw00 hinc00
mhmval00 1 NA NA NA NA
col00 NA 1.0000000 0.6839701 NA NA
incpc00 NA 0.6839701 1.0000000 NA NA
hincw00 NA NA NA 1 NA
hinc00 NA NA NA NA 1
@castower Hey Courtney,
I don't think you're doing anything wrong but there is some correlation with col00
. As far as the other columns, this is where I would need to examine you're entire script.
From the snippet you shared with me, it looks like you did not omit the records with NA
values. By including those values, cor()
doesn't know to include the valid non-NA
values from those columns with missing data.
From the documentation
, you'll want to use the argument use
:
an optional character string giving a method for computing covariances in the presence of missing values. This must be (an abbreviation of) one of the strings "everything", "all.obs", "complete.obs", "na.or.complete", or "pairwise.complete.obs".
cor(houses, use="pairwise.complete.obs")
This is a great example of a downstream (at the bottom of the script) side effect created by an upstream (at the top of the script) action. In this case, it was the action to not drop the NA
records at the beginning - via na.omit()
that is causing you to have these NA
values from the cor()
output.
@cenuno So when I print the table with the head function it shows that the track IDs for both datasets are titled "tractid" so it looks like both are still there.
For some reason when I run the code you provided I'm getting the error:
Error: '/Users/mbpeter4/Desktop/CPP 528/Week 2/Lab 2//Users/mbpeter4/Desktop/CPP 528/Week 2/Lab 2/ltdb_std_2000_sample.csv' does not exist.
And I have double checked the path and replaced it and that path is working for the code that I wrote before.
@cenuno So I just reran my code and it seems that when I renamed the track id with this code:
dat_2000 %>%
rename( tractid = TRTID10)
It's not sticking to the data. Is there a line that I forgot to change it throughout the dataset not just when I print it after this function?
@castower Hey Courtney,
I don't think you're doing anything wrong but there is some correlation with
col00
. As far as the other columns, this is where I would need to examine you're entire script.From the snippet you shared with me, it looks like you did not omit the records with
NA
values. By including those values,cor()
doesn't know to include the valid non-NA
values from those columns with missing data.From the
documentation
, you'll want to use the argumentuse
:an optional character string giving a method for computing covariances in the presence of missing values. This must be (an abbreviation of) one of the strings "everything", "all.obs", "complete.obs", "na.or.complete", or "pairwise.complete.obs".
cor(houses, use="pairwise.complete.obs")
Avoid downstream problems by being an upstream programmer
This is a great example of a downstream (at the bottom of the script) side effect created by an upstream (at the top of the script) action. In this case, it was the action to not drop the
NA
records at the beginning - viana.omit()
that is causing you to have theseNA
values from thecor()
output.
@cenuno thank you! I re-ran the entire data set through na.omit()
and that fixed it.
@meliapetersen
That is a file path error so upon inspecting your error message, I'm seeing something that probably is a copy & paste mistake:
# what you have
Error: '/Users/mbpeter4/Desktop/CPP 528/Week 2/Lab 2//Users/mbpeter4/Desktop/CPP 528/Week 2/Lab 2/ltdb_std_2000_sample.csv' does not exist.
Eliminating the double file paths should fix this:
# potential fix
/Users/mbpeter4/Desktop/CPP 528/Week 2/Lab 2/ltdb_std_2000_sample.csv
here
packageSince we're talking about file paths, I would really like to see you use the here
package to have code that is easier to maintain (especially when you start sharing code with your partners!). You can revisit the overview into the here
package in the Week 01 lecture video (from 5:36 - 17:57).
@cenuno So I just reran my code and it seems that when I renamed the track id with this code:
dat_2000 %>% rename( tractid = TRTID10)
It's not sticking to the data. Is there a line that I forgot to change it throughout the dataset not just when I print it after this function?
@meliapetersen Hi Melia,
Yes, you'll want to save your changes in an object via <-
or =
; without that, your logic will always be printed to the console and never saved.
# storing results in new object
dat_2000_clean <-
dat_2000 %>%
rename(tractid = TRTID10)
@cenuno That was the problem!!! I was able to merge it, thank you so much! I will go back and use the here() function for the pathways, thank you for pointing that out.
@sunaynagoel I would need to see how you created your dat_2000 file because I'm getting something different here when I follow your code:
dat_2000_urban <- merge( dat_2000, cw_urban, by.x = "cbsa10", by.y = "cbsa") > nrow( dat ) [1] 72693 > nrow( dat_2000_urban ) [1] 217771
Do you see the problem? This is a common mistake with merges, but it causes big issues because you blew up your data set from 72,000 census tracts to 217,000 tracts. You have created duplicate rows in your file.
The crosswalk is organized by county. There are just over 3,000 counties in the US (plus some extra for Puerto Rico). But only 388 "cities" (core based statistical areas):
> nrow( cw ) [1] 3293 > length( unique( cw$fipscounty ) ) [1] 3292 > length( unique( cw$cbsaname ) ) [1] 388
If you want to merge by CBSA ID you need to create a CBSA crosswalk so you are not duplicating rows:
> cbsa <- + cw %>% + filter( urban == "urban" ) %>% + select( cbsa, urban ) > cbsa <- unique( cbsa ) > nrow( cbsa ) [1] 387
You can use that crosswalk for the merge. But you might notice you have already filtered out all rural areas, so instead you can use this set of CBSA ids to select your appropriate rows:
cbsa.id <- cbsa$cbsa keep.these <- dat_2000$cbsa10 %in% cbsa.id dat_2000_urban <- filter( dat_2000, keep.these )
The bigger problem is you can't use this approach to add urban/rural attributes to the sample file because it does not contain the CBSA variable. For these if you need to merge by County FIPS you can construct the FIPS code by combining state and county codes from those files.
The annoying thing is that leading zeros are dropped, so county 02-075 will show up as 2-75 if you simply paste the state FIPS and county FIPS. Instead you need to add the leading zeros back. Something like this:
st.fips <- state + 10000 st.fips <- substr( st.fips, 4, 5 ) # extract last two numbers ct.fips <- county + 10000 ct.fips <- substr( ct.fips, 3, 5 ) # extract last three numbers fips <- paste0( st.fips, ct.fips )
That should match the fipscounty variable in the crosswalk, though you might need to add a leading zero back or drop the leading zero from the other now.
I will sometimes create a new FIPS with the format:
id-99-999 # county id-99-999-999999 # tract
Since it has a string you will never lose a leading zero, and it's easier to parse state, county, and tract FIPS with some delimiter in the string.
@lecy, @cenuno Is it possible to share a code through tutorial to create new, unique tract-id in crosswalk data-set? Much appreciated. ~Nina
@cenuno I am currently trying to change my file path with the here() package, but I keep getting an error message:
# Load Data
dat <- read_csv(here("data/raw/Harmonized_Census_Tracts/ltdb_std_all_sample/ltdb_std_2000_sample.csv"))
dat.full <- read_csv(here("data/raw/Harmonized_Census_Tracts/ltdb_std_all_fullcount/ltdb_std_2000_fullcount.csv" ))
URL <- "https://data.nber.org/cbsa-msa-fips-ssa-county-crosswalk/cbsatocountycrosswalk.csv"
crosswalk <- read_csv( URL )
Error: '/Users/mac/data/raw/Harmonized_Census_Tracts/ltdb_std_all_sample/ltdb_std_2000_sample.csv' does not exist.
I'm not sure how to force it to search through my group's Github repository files instead of users/mac.
-Courtney
Hi Courtney,
You need to have your repository as a RStudio Project. That process helps the here
package understand what the working directory is for a particular repository.
To learn how to set that up, please see this portion of this lecture video: https://youtu.be/JOH3pZ47MVY?t=336.
Respectfully,
Cristian
— Cristian E. Nuno
From: Courtney notifications@github.com Sent: Wednesday, April 1, 2020 9:51:43 PM To: DS4PS/cpp-528-spr-2020 cpp-528-spr-2020@noreply.github.com Cc: Cristian Ernesto Nuno cenuno@syr.edu; Mention mention@noreply.github.com Subject: Re: [DS4PS/cpp-528-spr-2020] LAB-02 (#7)
@cenunohttps://github.com/cenuno I am currently trying to change my file path with the here() package, but I keep getting an error message:
dat <- read_csv(here("data/raw/Harmonized_Census_Tracts/ltdb_std_all_sample/ltdb_std_2000_sample.csv")) dat.full <- read_csv(here("data/raw/Harmonized_Census_Tracts/ltdb_std_all_fullcount/ltdb_std_2000_fullcount.csv" )) URL <- "https://data.nber.org/cbsa-msa-fips-ssa-county-crosswalk/cbsatocountycrosswalk.csv" crosswalk <- read_csv( URL )
Error: '/Users/mac/data/raw/Harmonized_Census_Tracts/ltdb_std_all_sample/ltdb_std_2000_sample.csv' does not exist.
I'm not sure how to force it to search through my group's Github repository files instead of users/mac.
-Courtney
— You are receiving this because you were mentioned. Reply to this email directly, view it on GitHubhttps://github.com/DS4PS/cpp-528-spr-2020/issues/7#issuecomment-607619491, or unsubscribehttps://github.com/notifications/unsubscribe-auth/AFZB2SYTFIE7NNNV2EGXF2DRKQKV7ANCNFSM4LS3AN3A.
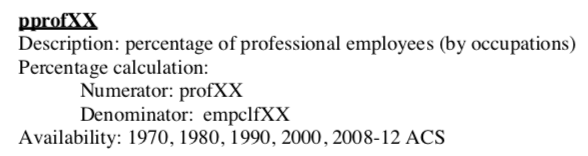
I noticed that median home value data is present for 2000 but not for 2010. This is from folder harmonized_dataset_part01 and files ltdb_std_2000_sample.csv & ltdb_std_2010_sample.csv. In my understanding it is one of the important variable to understand neighborhood changes. Am I missing anything? Where do I get that variable for 2010 so I can compare two time periods.
Thanks ~Nina