 WillGiang
commented
6 years ago
WillGiang
commented
6 years ago I brought up an issue with the boxplots in Slack
With regards to the outliers for Disability, they're from Washington DC and Puerto Rico. The outlier for Poverty is Puerto Rico.
 bbrewington
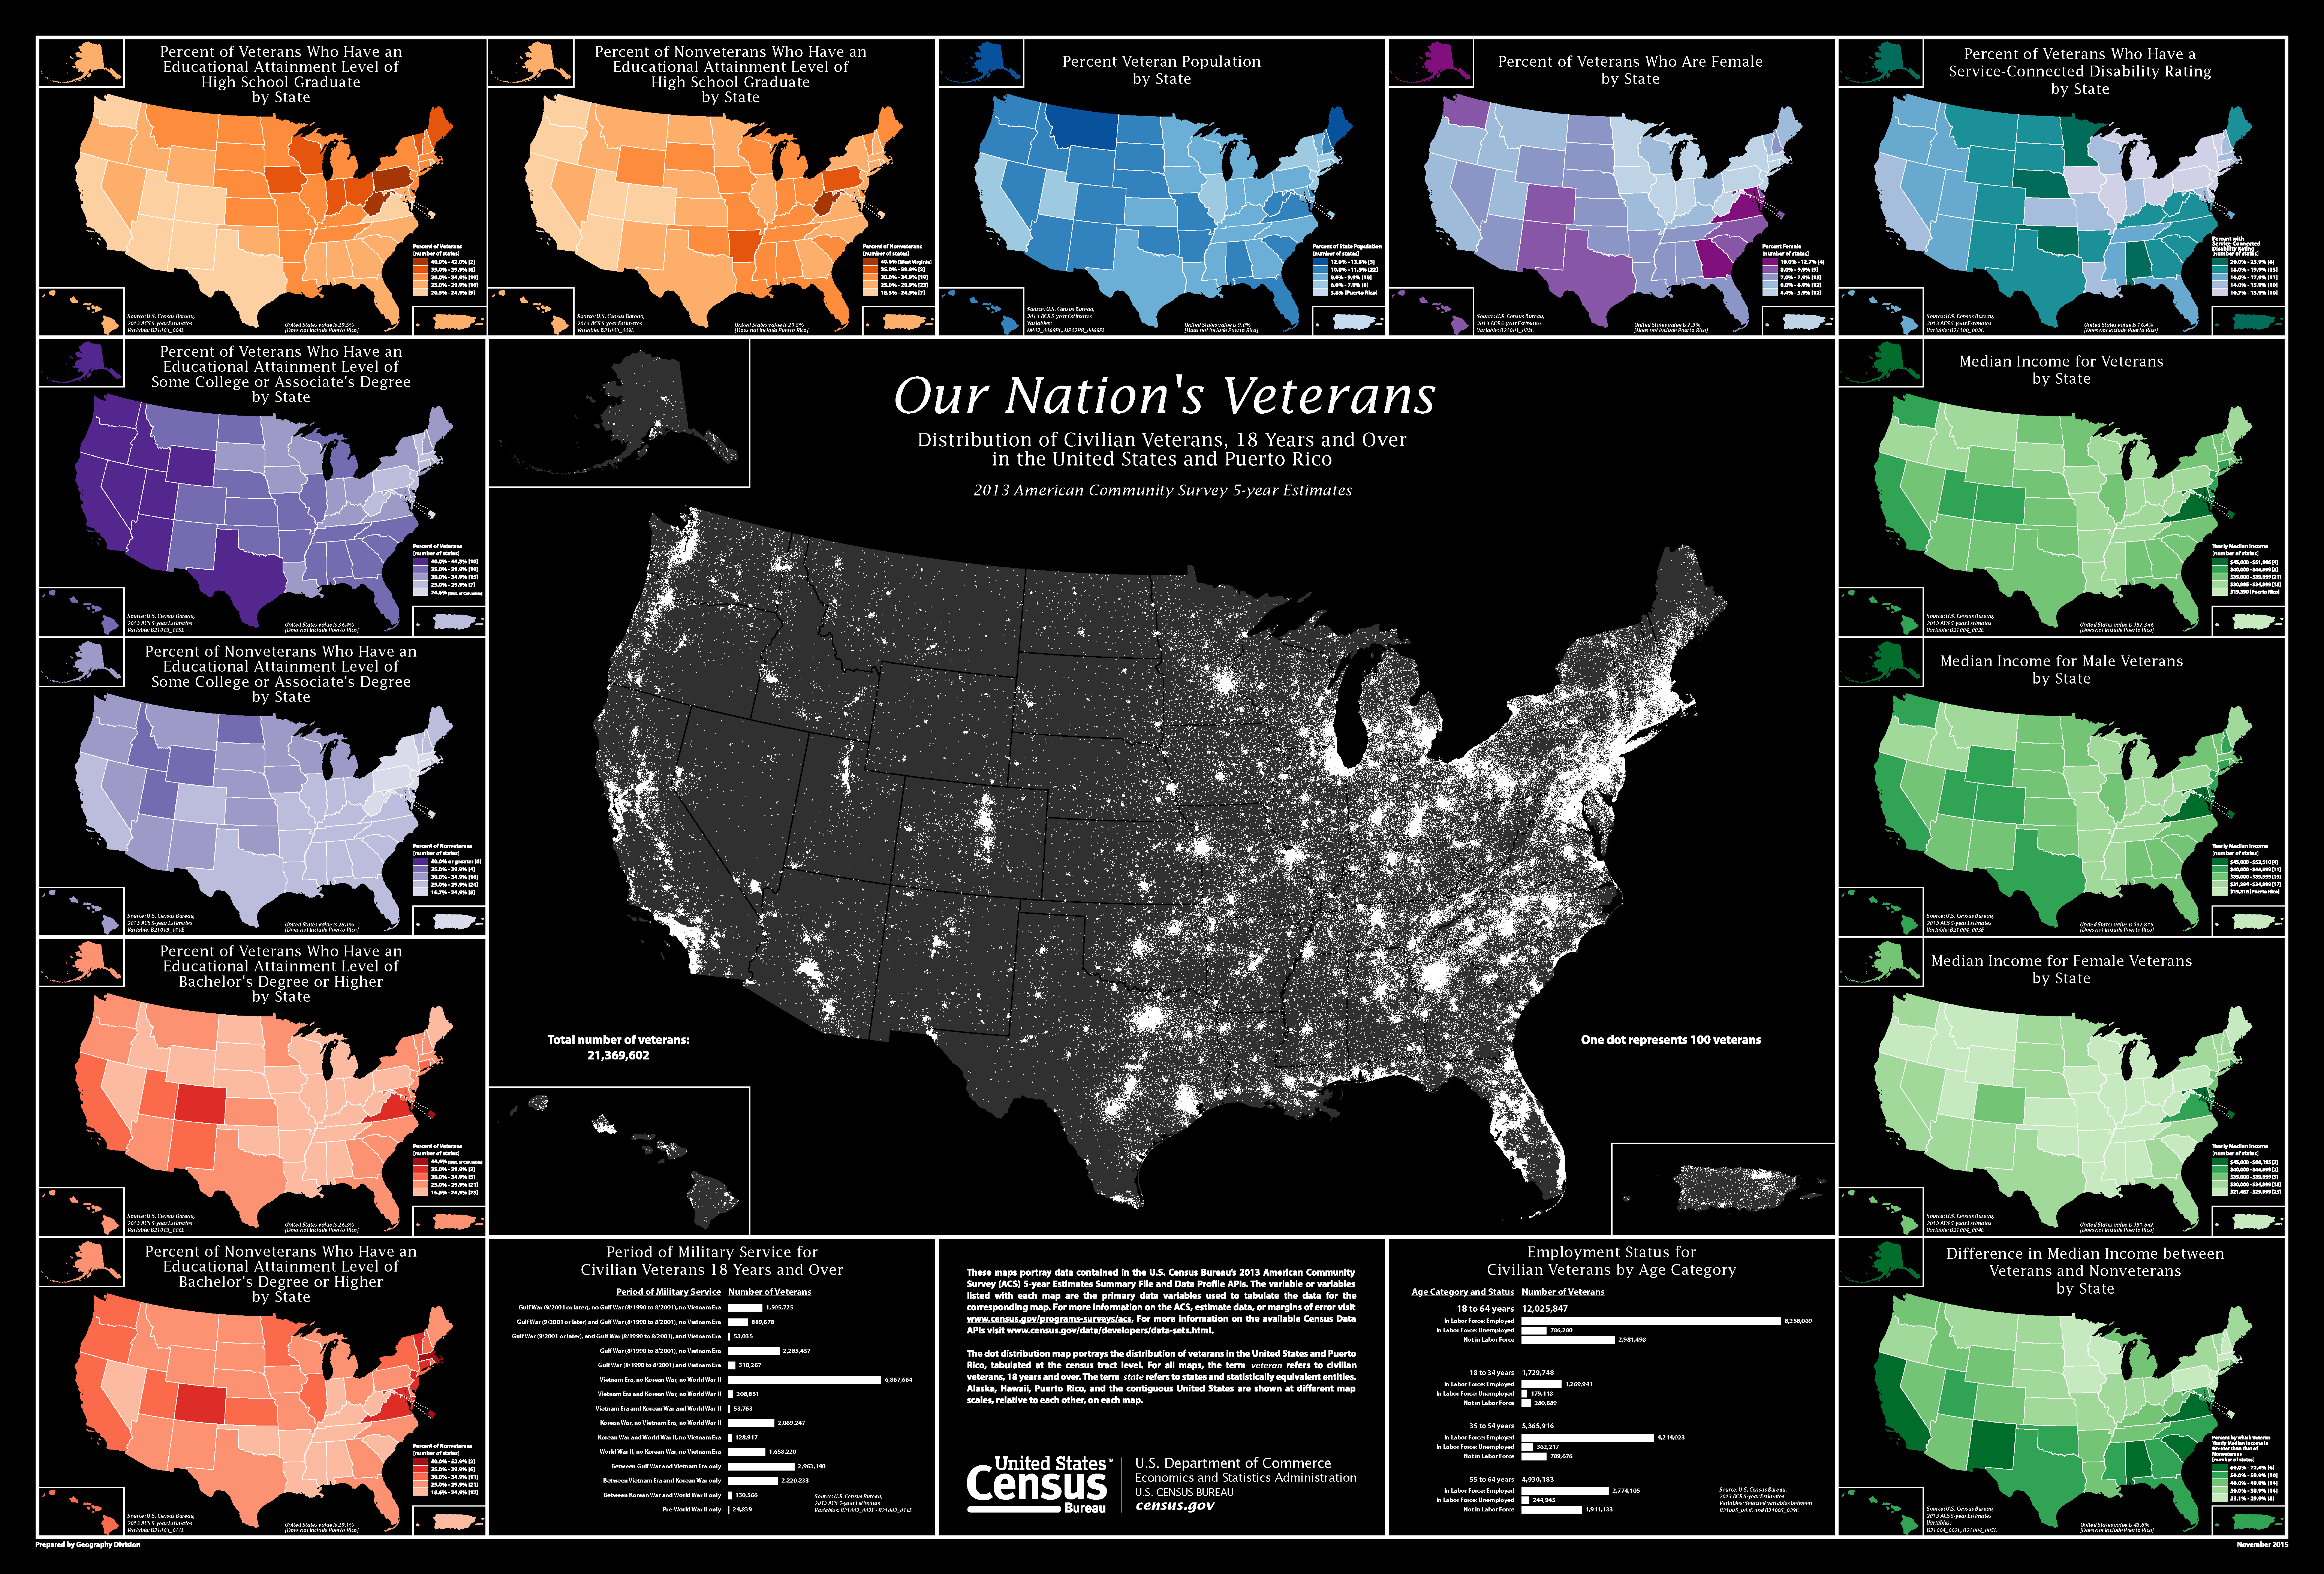 [Source: US Census Bureau]
Following @synflyn28's initial demographic exploration, I have some additional follow up questions ...
Feel free to add additional questions in the comments