 brunchboy
commented
7 years ago
brunchboy
commented
7 years ago Thank you! I will have to see if I can get my players to respond to this request, or rekordbox, and look into adding it into Beat Link.
Closed jan2000 closed 5 years ago
brunchboy
commented
7 years ago Thank you! I will have to see if I can get my players to respond to this request, or rekordbox, and look into adding it into Beat Link.
brunchboy
commented
6 years ago @jan2000 now that I am working out how to pull the .ext files, it would be nice to be able to start displaying these. I am going to have to learn a little python, it seems, so many people are using it these days. I don’t quite understand your description or the code, but I still have too much else going on to focus on it. I do wonder, though, have you looked at the PWV5 tag that rekordbox seems to be writing now as well? It is even bigger!
 jan2000
commented
6 years ago
jan2000
commented
6 years ago Yes I have looked at PWV5, it contains the color wave zoom data for nxs2/mk2 players. It was a lot easier to figure out than the PWV4 data as it is not used by rekordbox. It basically has the wave as 16 bits, with 5 bits for height and 3 bits for each color.
I also took another look at the PWV4 data. The decoding must be done slightly different than in the example above. I was planning implement both in https://github.com/flesniak/python-prodj-link as it also in python, however I just haven't found the time for it.
brunchboy
commented
6 years ago If you can figure out any more details, that would be great! I am focusing on downloading the files for a bit, but hope to be able to draw both of these soon.
jan2000
commented
6 years ago Ok, the code example above should be discarded. I wrote an improved implementation and added this to python-prodj-link.
All the info on how to access and display the nxs2 waveforms (blue and color, preview and wave zoom) can be found in this commit: https://github.com/jan2000/python-prodj-link/commit/52fb526e7133936b7ba07125f5d54d4f87dd5de1

brunchboy
commented
5 years ago Yes, thank you, I saw that merge request, it’s wonderful! I have the scrolling waveform interpretation working in my own test code now, but I am having trouble figuring out what is going on in the waveform preview. What are the “front” and “back” waveforms? And why is the height calculation so fiendishly complicated?
jan2000
commented
5 years ago Unlike the other waveforms the nxs2 waveform preview is in use by rekordbox. So it is a bit more detailed than the others. And thus a little more complicated. However, apart from the weirdness with blueness it is fairly straightforward. If you look closely to the preview in rekorbox or on the nxs2 you will see there are in fact two waveforms on top of each other. They share the same color (or blueness), only the back waveform is slightly darker. The height of the front and back waveforms are not complicated. The height of the back is the max of d3 and d4, the height of front is d5. The rest of the calculations are done to normalize the height and interpolate the width to make it look as close to as seen on nxs2 as possible.
brunchboy
commented
5 years ago But I can think of no rational explanation that, for example, the height of the back would be the max of d3 and d4, and the front would be d5. From the perspective of designing a meaningful data representation format, I mean. It seems so utterly arbitrary. And how on earth did you figure this out?
Oh! I finally understood what you are doing in lines 104-110, you are normalizing the hight of the waveform so it always takes the full display height? I think I will omit that step, it reduces the actual information value to the user. But you have noticed that the nsx2 players actually do that? Since I don’t have access to any such players, I have to rely on your analysis. For which, thanks again, so much!
brunchboy
commented
5 years ago (By turning on the screen magnifier in MacOS, I have been able to look more closely at what rekordbox is drawing, and it does definitely seem to follow the pattern you describe with the front and back waveforms, although I have not yet tried to compare with actual data.) Oh, I forgot my other question, what did you mean about interpolate width? Isn’t width always one pixel per entry? Or did you mean height, as in what is going on in lines 104-110, perhaps?
Once I finish my current marathon of coding I need to add this stuff to the dysentery protocol analysis and credit you. 😄
brunchboy
commented
5 years ago Oh, and one more question (for now anyway, can’t promise it is the last ever! 😉)… do the nxs2 players display all 1200 columns worth of the preview data? Or do they average or subsample it to some smaller pixel width? Can you tell?
brunchboy
commented
5 years ago I have this basically working in Beat Link Trigger, but so far only using Crate Digger, because I need to know the separate message and response types used to query the preview and scrolling waveforms from dbserver. In your Python code only the preview message type is present (the same one you listed above). Can you find out the code used to request the color scrolling/zoomable waveform?
And thanks so much, I cannot even imagine how you figured out the color algorithm for the preview, it is so complex and unusual!
brunchboy
commented
5 years ago  jan2000
commented
5 years ago
jan2000
commented
5 years ago I saw that you already understood about the 0x2c04 nxs2 ext type requests. About the height normalisation: yes the players do that and I think rekordbox as well. About the horizontal interpolation/downsampling: the cdj-2000nxs2 draws the 1200px waveform at a width of 600px, the xdj-1000mk2 at 500px. How the height and color information is downsampled is not 100% certain yet. However, using nearest neighbour for color and max value for height as done in the code I committed seems to match how it is rendered on the players.
To understand the rationale of the waveform better we take a look at the preview waveform and its channels of an audio file containing a 10 second sine sweep from 20hz to 20khz:
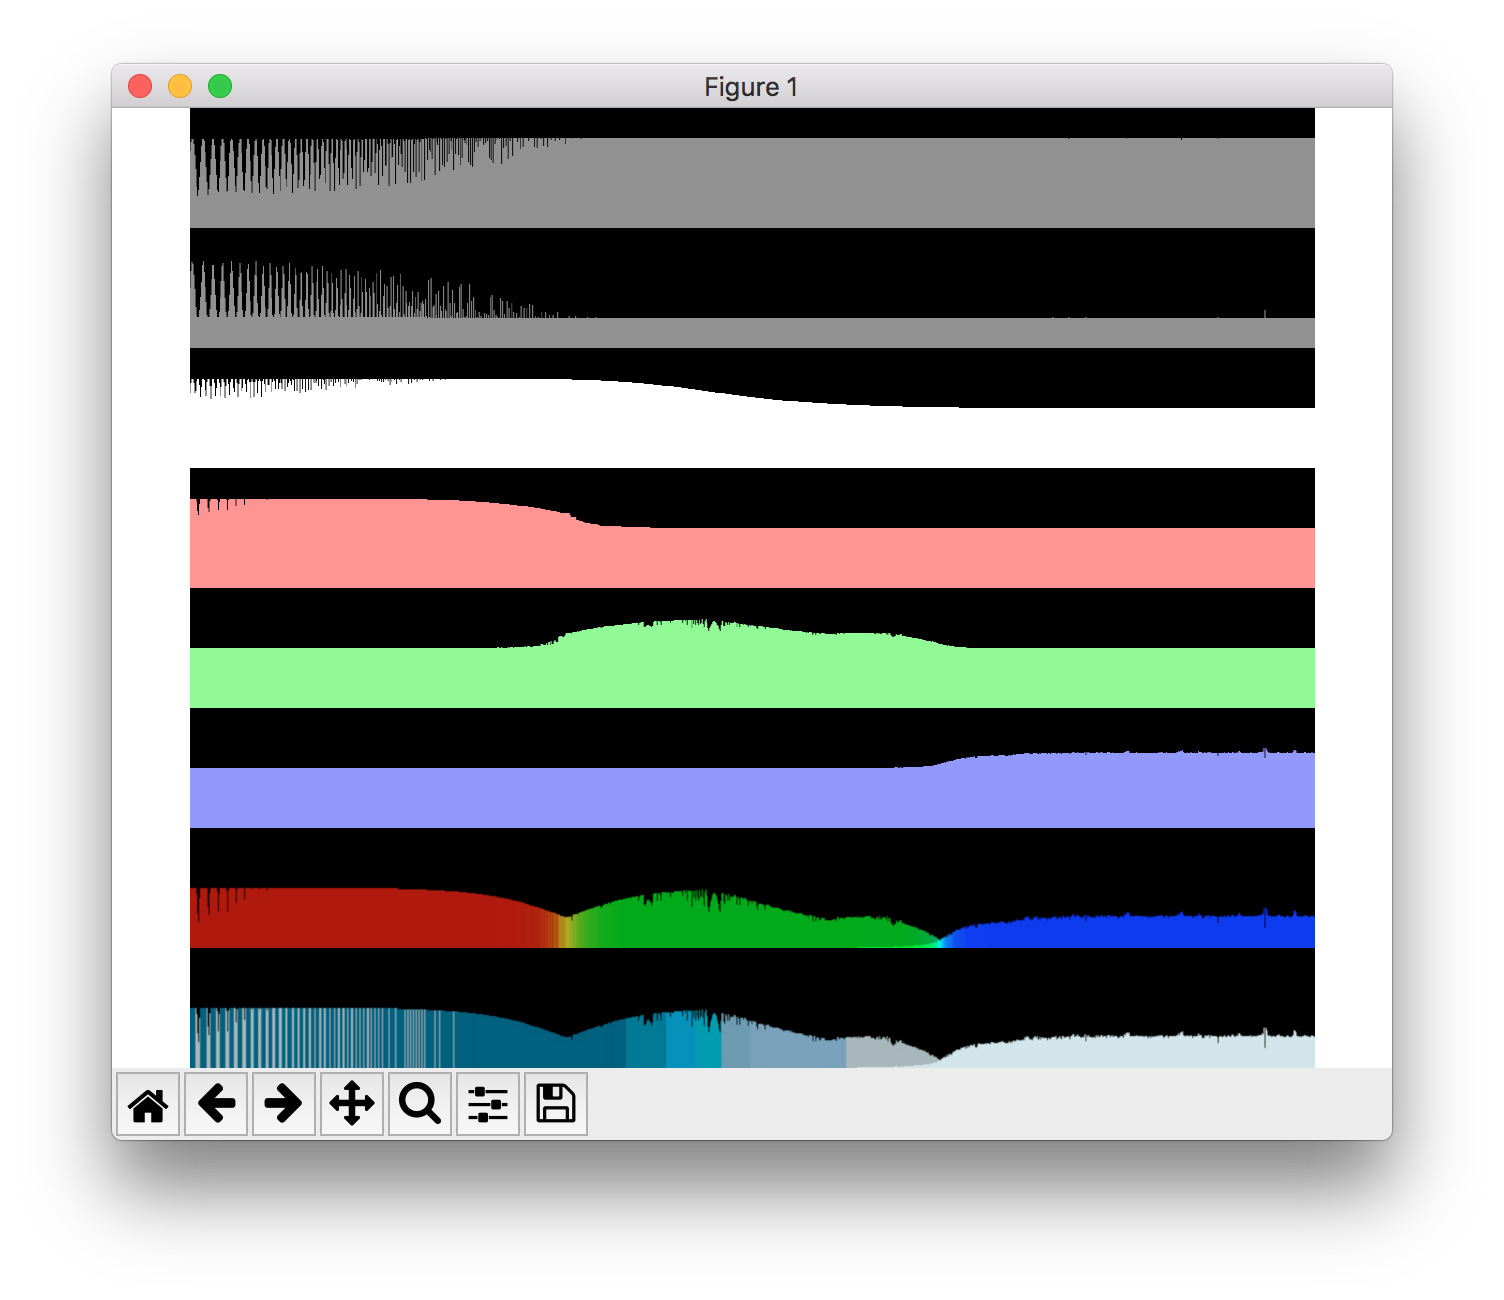
(Y-axis for channels d0-d5: -128 to 127, the waveform previews: 0 to 127)
Looking at the channels we can clearly see that channels d2-d5 represent each some part of the frequency spectrum:
It makes sense that the height of the waveform represents the whole spectrum and thus is the max of d3, d4, d5. The color is determined by either the the 3 thirds for the color preview, or by the lower half (d2) for the blue preview. To accentuate the high frequencies it is drawn as a slightly brighter waveform on top of the total waveform for both the color and blue waveform. (Look at the part between the green and the blue bump, you can see the two waveforms on top each other.)
The only thing I could not understand is the meaning of channels d0 and d1. However they do influence the blue waveform as seen by the white lines on the left part of the preview. How this should be rendered is determined by trial and error and may not be 100% correct.
brunchboy
commented
5 years ago Yes, thank you, I did figure out the nxs2 requests, and am working on implementing them in Beat Link. When I update the dysentery research paper to talk about color waveforms, I would love to include the above channel diagram, with attribution, if you permit it. The quality of your research is inspiring.
brunchboy
commented
5 years ago I found that averaging the colors and heights of the color preview columns worked very well for downsampling them into the 400 pixels I have currently available in my Player Status window. Trying to just take every third value led to horrible aliasing with some files, but averaging looked great. What I plan to do longer-term is render the full preview to an offscreen bitmap, and then use graphics toolkit methods to scale it to fit the space it has in my new interface elements. That will work well for both kinds of previews, and take advantage of however much screen space the user is willing to allocate for the window.
 nicokaniak
commented
5 years ago
nicokaniak
commented
5 years ago Any chance to do this, but for Max4Live so as to use it in Ableton?
brunchboy
commented
5 years ago @nicokaniak feel free to port it! I have created incredibly detailed language-independent documentation in the form of the dysentery project’s protocol analysis paper. I previously created a Max package to host Afterglow, the project that started all these discoveries, in Max (and Max4Live), but then Cycling ’74 killed off Java support for Max. So Beat Link can’t work in that world unless someone rewrites all of this in node.js. You could be that person!
 GuyHarwood
commented
5 years ago
GuyHarwood
commented
5 years ago someone started a typescript implementation based upon @brunchboy 's work here
nicokaniak
commented
5 years ago @brunchboy if only I knew how to properly code & stuff....😅
brunchboy
commented
5 years ago Very interesting, @GuyHarwood, thanks for the link! It seems they haven’t gotten all that far even compared to the state of Beat Link two years ago, but that is definitely a starting point, and if I ever wanted to do something similar, I now have pointers to how one can do the low-level networking stuff in Node. JavaScript (and TypeScript) have such broken numerics that parts would be painful, but it should all be possible. It’s neat to see they chose RxJs for event propagation, I was tentatively imagining I would take the same approach if I ever wrote such a thing yesterday.
Shortly after I replied yesterday @nicokaniak I heard from someone else trying to figure out how to use Beat Link from Pure Data on a Raspberry Pi, which is a very similar environment to Max/MSP (and thus Max4Live). And my conversation with them led me to some very interesting ideas about creating a wrapper for Beat Link that could be controlled using Open Sound Control (which is usable from both Max/MSP and Pure Data). This would be useful to both of you (and a lot of other people), so I will probably start trying to build it soon.
brunchboy
commented
5 years ago @nicokaniak can you give me more details about what you are trying to do in Max4Live? Open Beat Control is coming along nicely, and I have been using it within Max to react to events on the CDJs as well as starting to tell them to do things. So I can start exploring your desires too: in what form would you want the waveform data, the raw information returned by the CDJs? Rendered as a picture, and if so, in what format? And would you want it as a file, or delivered as a series of OSC blobs?
nicokaniak
commented
5 years ago Well, "do" is a big word as I am in no means a coder, but what I would like to have is the ability to see a waveform in Live in the same gamut of colours as in the Rekordbox or CDJ. So far iv been using Scopium for it, but it shows it in a slightly different way. Scopium shows all colours and overlapping, while Rekordbox/CDJ shows the colour of the predominant frequency. I guess having this feature would be nice cause the multi-colour waveform of CDJ can show very fast if a mix is well done or not depending on the overall shifting of colours.
brunchboy
commented
5 years ago Ah, I see… well, yes, you’re going to need to team up with someone who is a skilled Max patch programmer (which definitely does not describe me). I will proceed to build something that makes the most sense from an implementation point of view. If you find someone to do the Max4Live programming to build your idea, please put them in touch with me and I will meet them in the middle. 😄
nicokaniak
commented
5 years ago Thanks @brunchboy !! will see fit to do so! :)
The type to request the improved waveform preview that is used on the CDJ-2000nxs2 and the XDJ-1000mk2 is
2c04.Example request:
The data returned contains the PWV4 waveform data from the
ANLZ0000.EXTfile. (See: https://reverseengineering.stackexchange.com/a/5892)The waveform preview seem to contain 6 channels of 1200 bytes. These 6 channels contain the data for both the colored and the blue waveform.
It is not so simple to see how the 6 channels are converted into the two waveforms, so I have written a small script to analyse the data. The result looks kinda like the waveform preview in rekordbox and on a XDJ-1000mk2, but it still needs some work: