Hey, @SchmidtPaul, I think that will be such a nice feature. I am going to add that and deploy it to CRAN in the following weeks. Thank you.
Closed SchmidtPaul closed 5 months ago
Hey, @SchmidtPaul, I think that will be such a nice feature. I am going to add that and deploy it to CRAN in the following weeks. Thank you.
Hey, just a little reminder that I am still very interested in this. But of course, I understand if you have other priorities.
FielDHub now returns the plot using the method plot(). This plot object is a ggplot2 object, so we can modify it as any other ggplot2 figure.
library(FielDHub)
library(ggplot2)
The same example you shared,
x <- CRD(
  t = letters[1:3],
  reps = 3,
  seed = 42
)

y <- plot(x)

p <- y$p
p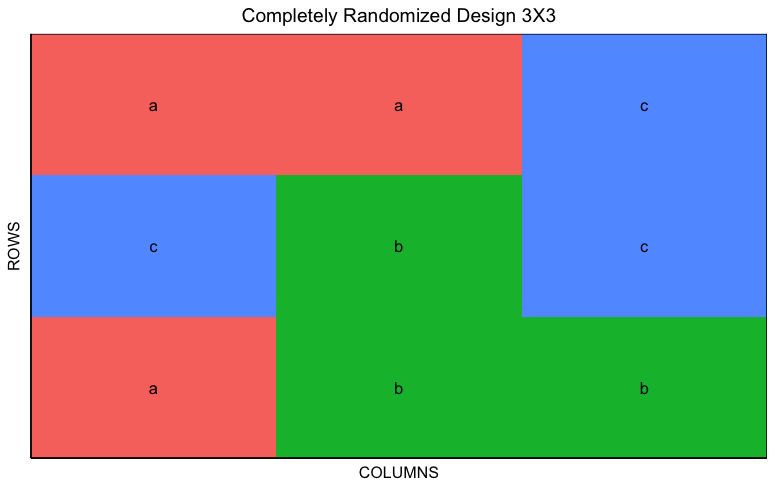
crd_layout <- y$p +
  ggtitle("FielDHub is great") +
  scale_fill_manual(values = c("red", "blue", "green"))

crd_layout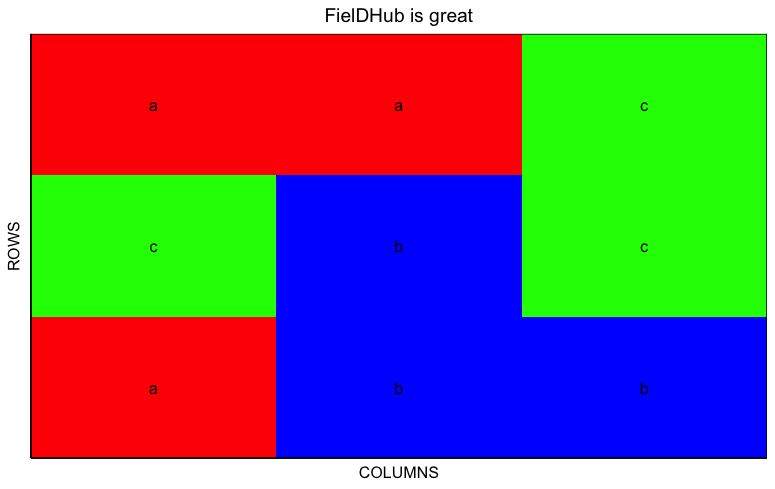
v <- RCBD(
  t = letters[1:6],
  reps = 3,
  seed = 42
)

w <- plot(v)
p <- w$p
p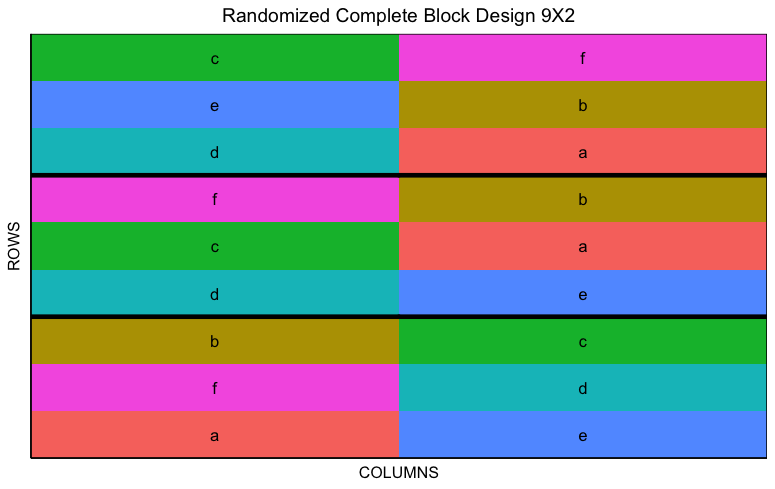
rcbd_layout <- w$p +
  ggtitle("RCBD in FielDHub") +
  scale_fill_manual(values = c("red", "blue", "green", "yellow", "purple", "orange"))

rcbd_layout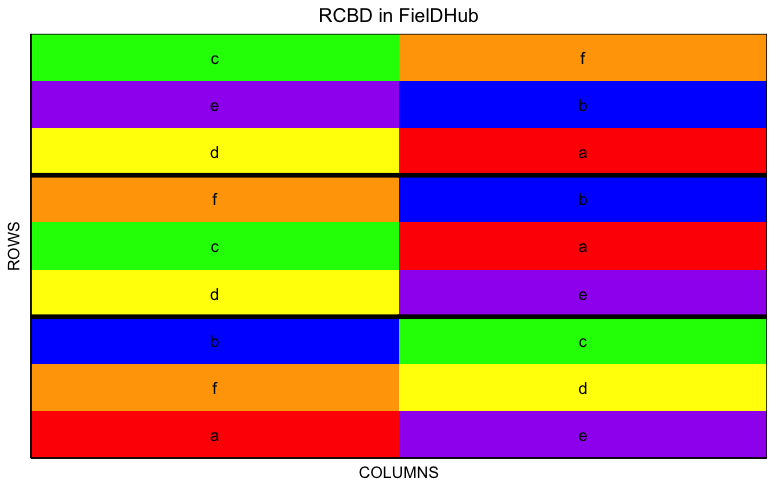
Let's add more features to the plot,
rcbd_layout <- rcbd_layout +
  scale_y_continuous(breaks = function(limits) seq(floor(limits[1]), ceiling(limits[2]), by = 1)) +
  scale_x_continuous(breaks = function(limits) seq(floor(limits[1]), ceiling(limits[2]), by = 1)) +
  theme_minimal() +
  guides(color = "none") +
  theme(plot.background = element_rect(fill = "lightgray"),
        text = element_text(size = 12),
        plot.title = element_text(face = "bold"))
rcbd_layout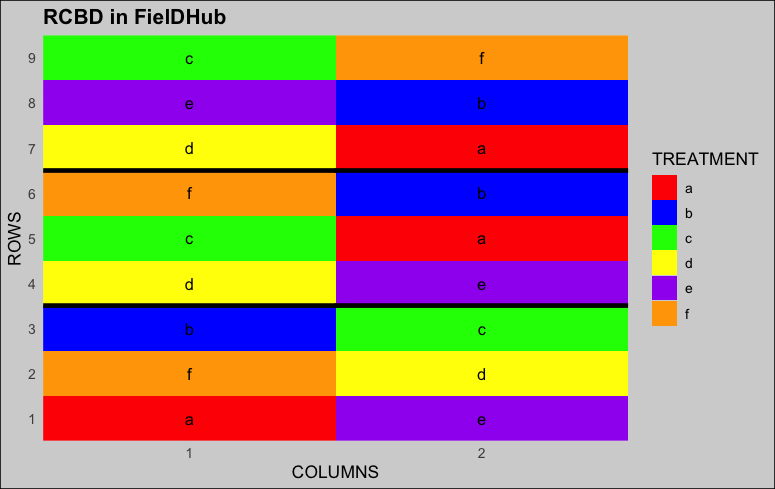
I think this way of modifying or customizing the plots is acceptable. What do you think? You can test this version using the GitHub version. I am planning to release a new version of the app to CRAN this weekend.
Fantastic! Thanks a lot! I immediately applied it to my website - check out the first few examples here.
I am closing this issue now because it has been solved.
One final note, though. I am assuming you switched from desplot::desplot() to desplot::ggdesplot(). While this should generally not be a problem and instead be advantageous since ggplot is better in several aspects, note that desplot::ggdesplot() is not as complete as desplot::desplot() as you can e.g. see in this or this issue. Again, it shouldn't actually cause any problems except in special situations but I am just pointing it out.
Finally, though, I have not tested it but suspect it would not be as easy to change the colors of the yellow and black lines generated by out1= and out2= right? At least I don't know how to change the static color of an existing layer.
Hey, I want to make use of your
plot()function (instead of manually creating my own desplots) for teaching purposes (see here) , but I would like to use other colors/layout. I thought I could simply create the resulting plot into an object and alter it afterwards, but the function isnt acutally returning the plot, right? It's just showing it:I guess I would only want something like this instead. And as you may know, updating such a plot would be quite simple:
Created on 2023-11-09 with reprex v2.0.2