 PaulWessel
commented
1 year ago
PaulWessel
commented
1 year ago Think this looks good. Pretty sure Pluto was only imaged from one side of the planet - there is no global view:
Closed Esteban82 closed 10 months ago
PaulWessel
commented
1 year ago Think this looks good. Pretty sure Pluto was only imaged from one side of the planet - there is no global view:
 Esteban82
commented
1 year ago
Esteban82
commented
1 year ago Yes, there elevation data in only "half" of the planet.
Esteban82
commented
1 year ago There is no defaults CPT for Venus and Pluto yet.
Script:
gmt begin planets_defaultCPT png
    gmt subplot begin 2x3 -Fs5/0 -B+n -Rd -JQ5c
        gmt grdimage -c @mars_relief_30m
        gmt grdimage -c @mercury_relief_30m
        gmt grdimage -c @moon_relief_30m
        gmt grdimage -c @venus_relief_30m   -Crainbow
        gmt grdimage -c @pluto_relief_30m   -Crainbow
gmt endWeren't there candidates from back when this started? I think I asked David but no reply. I can ask again.
Esteban82
commented
1 year ago I think I asked David but no reply. I can ask again.
Yes, I think so. Also we could ask in the forum.
PaulWessel
commented
1 year ago Dave says he worked up the Venus data in 2012 for use in Google Venus but Google never followed up. They fixed errors and filled in som gaps. I think we should use this data:
Here is a link to the grid and the analysis.
PaulWessel
commented
1 year ago An odd thing it is 0.04 deg longitude by 0.03 deg latitude. Will be a good test for our scripts! Pixels would be2.4 x 1.8 arc minutes.
Esteban82
commented
1 year ago I try to process it but I am not sure how to modify venus_relief.recipe (specially the table). Check the branch Venus_Sandwell.
PaulWessel
commented
1 year ago I cannot find _venusrelief.cpt in that branch or elsewhere ?
Esteban82
commented
1 year ago I cannot find _venusrelief.cpt in that branch or elsewhere ?
See #197.
Esteban82
commented
1 year ago Well, Paul asked and NASA doesn't have CPT for Venus and Pluto. So I propose to choose some master CPT that are already available. In the future it can be changed to a specific CPT.
I think that the simplest solution would be to choose batlow (the color-blinded version of the rainbow).
First I do it directly with batlow but the distributions of altitudes led to few colors on the map. So I use grd2cpt from the full resolution available.
gmt set GMT_DATA_SERVER=candidate
planet=venus
dem=@${planet}_relief_01m
cpt=${planet}_relief.cpt
gmt grdcut $dem -Rd -G${planet}.nc
gmt grd2cpt ${planet}.nc -Cbatlow -Z > $cpt
gmt begin ${planet}_relief_cpt png
    gmt grdimage ${planet}.nc -Baf -Rd -C$cpt
    gmt colorbar -Ba
gmt end
gmt grdimage ${planet}.nc -png ${planet}_batlow -Baf -Cbatlow
gmt set GMT_DATA_SERVER=candidate
planet=venus
dem=@${planet}_relief_01m
cpt=${planet}_relief.cpt
gmt grdcut $dem -Rd -G${planet}.nc
gmt grd2cpt ${planet}.nc -Cbatlow -Z > $cpt
gmt begin ${planet}_relief_cpt png
    gmt grdimage ${planet}.nc -Baf -Rd -C$cpt
    gmt colorbar -Ba
gmt end
gmt grdimage ${planet}.nc -png ${planet}_batlow -Baf -CbatlowSo my proposal is to use the cpt created with grd2cpt for Venus and Pluto. Maybe another master cpt could be used (instead of batlow) but in any case I think you have to use a CPT created with grd2cpt. Let me know if you agree so I can do the PR.
 joa-quim
commented
1 year ago
joa-quim
commented
1 year ago Those CPTs are not comparable. The one produced by grd2cpt is histogram equalized whilst the other is linear. The default CPT should not be a histogram equalized.
Esteban82
commented
1 year ago Ok, altough I don't understand why should not be a histogram equalized.
joa-quim
commented
1 year ago None of the other default CPTs in relief products are histogram equalized. Many people do not know what is an histogram equalized CPT.
Esteban82
commented
1 year ago Ok.
So, your proposal is to use batlow directly?
joa-quim
commented
1 year ago I don't particularly like it but I guess that with other master CPTs Venus will continue to be dull. Let's hear from others.
PaulWessel
commented
1 year ago Sure, agree with @joa-quim that we want a linear CPT, not adjusted by area coverage. That is a user thing.
PaulWessel
commented
1 year ago See if we can mix two CPTs or something funky. Batlow is a standard CPT in our setup so we dont to duplicate to venus_relief.cpt I think. Maybe mix the google rainbow with batlow or another and see what it looks like. Just make it non-boring (and linear).
Esteban82
commented
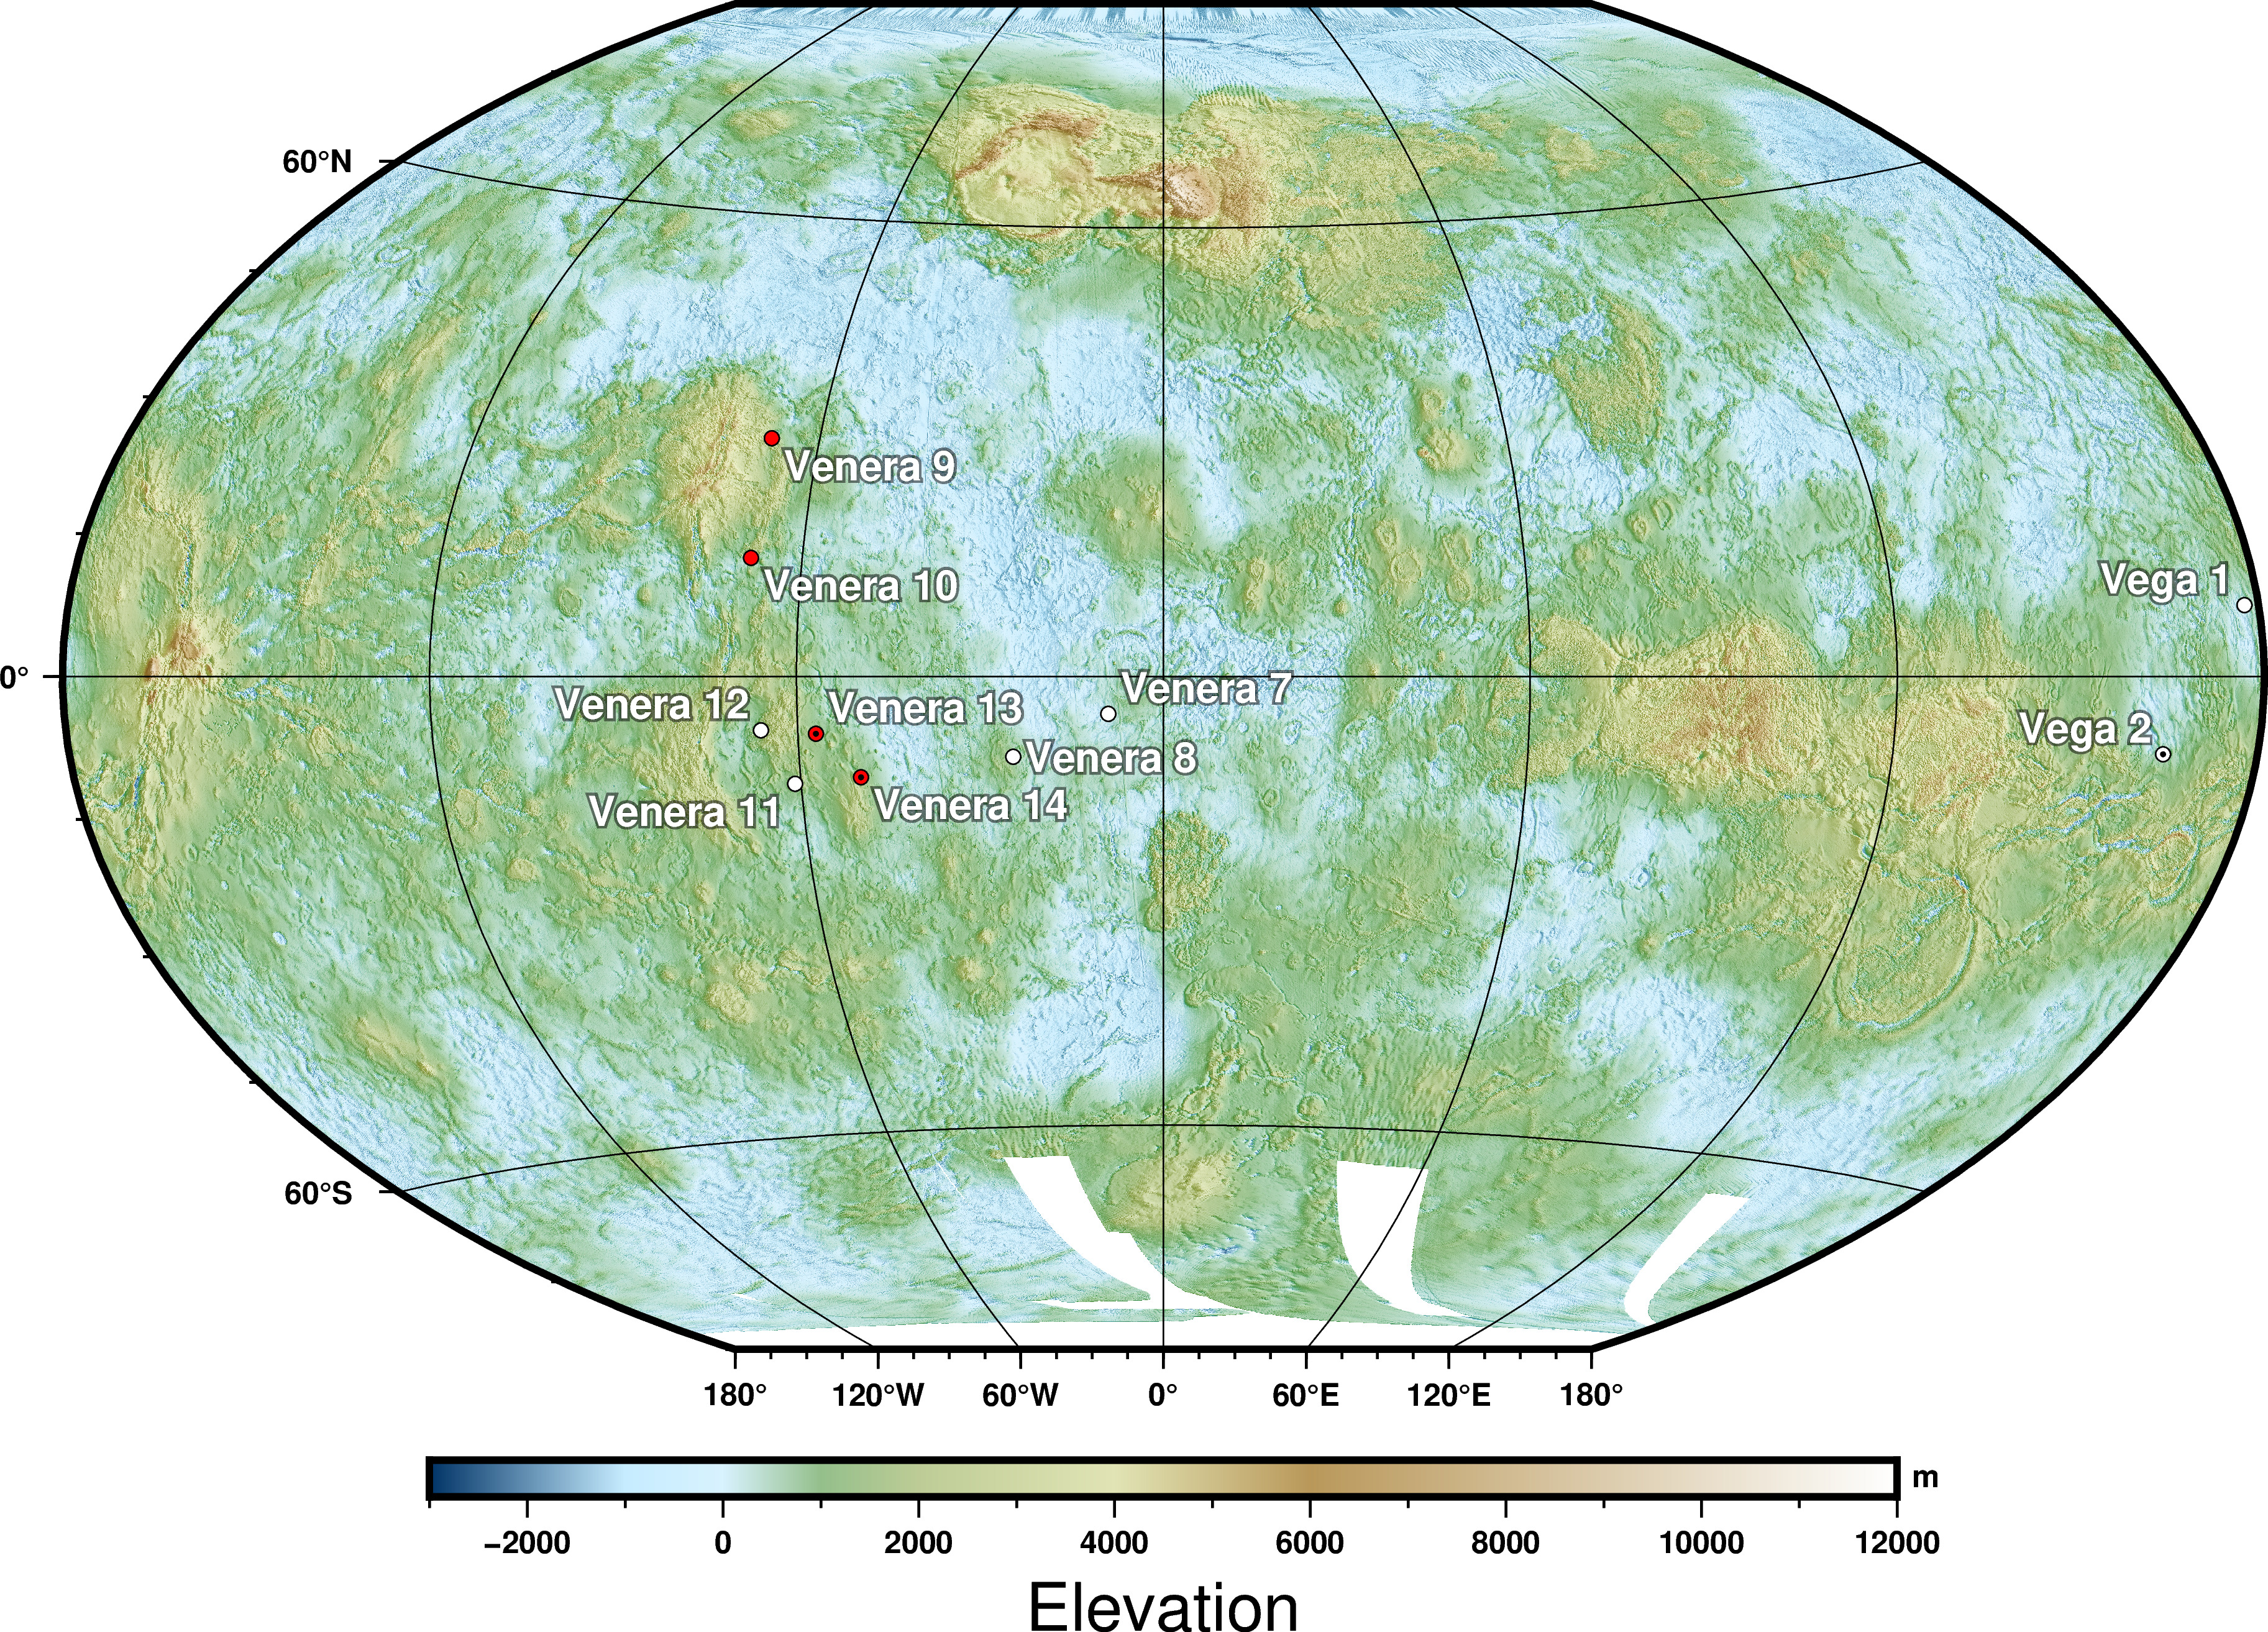
1 year ago What about the CPT used here? I think it wouldn't too dificult to make. https://en.wikipedia.org/wiki/File:VenusLanderTopo.jpg
PaulWessel
commented
1 year ago Fine with me. Maybe Venus enthusiasts or SCM fanatics will be forced to come up with a better one - which we then can update citing a "bug"!
joa-quim
commented
1 year ago Yep, it looks like a modified topo without the sharp transition at zero.
Esteban82
commented
1 year ago This is the map that I managed to make.
-3000   52/40/62    -2000   75/19/80    L
-2000   75/19/80    -1000   100/0/99    L
-1000   100/0/99    0   0/0/254 L
0   0/0/254 1000    4/255/0 L
1000    4/255/0 2000    255/255/2   L
2000    255/255/2   3000    255/168/0   L
3000    255/168/0   4000    255/85/0    L
4000    255/85/0    5000    254/0/0 L
5000    254/0/0 6000    194/24/7    L
6000    194/24/7    7000    131/48/16   L
7000    131/48/16   8000    117/81/45   L
8000    117/81/45   9000    152/125/98  L
9000    152/125/98  10000   185/168/150 L
10000   185/168/150 11000   221/212/203 L
11000   221/212/203 12000   253 B
B   black
F   white
N   128
Let me know what you think so I can make the PR (or not).
joa-quim
commented
1 year ago Maybe strip out the violet from lowest z's? It makes a sharp transition at ~-1
Esteban82
commented
1 year ago BTW, I made it getting the RGB values of the colors from the original file every 1000 m.
PaulWessel
commented
1 year ago I take it you did it along the middle of the bar where the intensity = 0?
PaulWessel
commented
1 year ago Hi @joa-quim and @Esteban82. Just doing a quick check with you on this. We apparently have/had a situation where down-sampled grids gained some NaNs from a source that had no NaNs. I think synbath and probably earth_relief did this. We then messed around with kludges to the filter width so those went away. But never felt good. Here are two plots of data (12.14.. seconds Mars spacing and 15s Earth relief spacing). Consider the first figure. We are filtering, say, the orange 15s data nodes to make a 30s grid (red squares). At each output node we imagine a circle (the small black and 3 gray for nearby nodes). If we just do something that takes 2 times the increment (converted to km) then we get the diameter, i.e., the full filter width expected by grdfilter. For very high resolutions we added some "noise" to the filter so it did not get NaNs, but it may have aliased. Notice the staroid shape of the gap between the four small circles. Data nodes in such areas do not enter in the filtering calculations. Note: R_p is the planetary radius and Delta is the output grid spacing.
For the coarser output grids you can imagine the same plot (denser x- and y-axes) but with a swarm of orange nodes, but all that means an even larger swath of 15s input nodes are left unused in the staroid. Of course, since this is Cartesian filtering (see #11) we do not deform the filter circle to an ellipse at heigher latitudes (see for 60N above) which would involve more nodes along parallels but remain the same along meridians.
I believe we need to increase the filter width so the we avoid these scenarios. The next plot shows what happens when we compute the initial radius to the diagonal corner (you see the circle goes through the (±0.25, ±0.25) nodes now, and this eliminates the staroid.
Now the filter circles overlap so the data half-way between output nodes are actually used for both nodes rather than barely getting data away from the output nodes. With this scheme, we get a filter width versus output grid spacing that looks like this:
If we look at what the filter weights are for the Gaussian filter along a crossection through two neighbour nodes we get this:
So you can see the old version (left) barely met half-way between the nodes, but now (right) we have some overlap that eliminates the staroid discussed above.
Because this change affects all the data products I think we need to reprocess all of them, add them to the candidate server, do some testing, and then we are ready for the data to come with the 6.5 release in mid-October (I think).
Comments appreciated.
Esteban82
commented
1 year ago I take it you did it along the middle of the bar where the intensity = 0?
No, but it doesn't seem to me that the colorbar has changes of intensity in the vertical. It might have colour transitions at other intervals (like every 500 m).
PaulWessel
commented
1 year ago It definitively has intensity changes vertically. Just look at the brown values round 10. Dark brown changes to almost white as you go along the y-direction of the bar. Even more so for 11 and 12.
Esteban82
commented
1 year ago It definitively has intensity changes vertically. Just look at the brown values round 10. Dark brown changes to almost white as you go along the y-direction of the bar. Even more so for 11 and 12.
It seems to me that you are looking at the map I made. Not the original one (https://upload.wikimedia.org/wikipedia/commons/9/98/VenusLanderTopo.jpg)
PaulWessel
commented
1 year ago And right you are! Sorry.
joa-quim
commented
1 year ago Hmm, given the richness of the images I'll look at them tomorrow afternoon (classes early morning kill me)
Esteban82
commented
1 year ago I contact the author (Andreas Hirner) of the wikipedia map and he sent me the CPT.
So, this is the map that I got
and here the CPT
# file venus.cpt
#COLOR_MODEL = RGB
#
-3000 50 40 60 -1000 100 0 100
-1000 100 0 100 0 0 0 255
0 0 0 255 1000 0 255 0
1000 0 255 0 2000 255 255 0
2000 255 255 0 5000 255 0 0
5000 255 0 0 7500 100 60 20
7500 100 60 20 12000 255 255 255
N 255 255 255
F 255 255 255
B 255 255 255
Andreas found the colors too bright and wanted to tone them down. What do you think? Should I try to do it? How?
PaulWessel
commented
1 year ago I would not bother unless you or @anbj plan to make lots of Venus maps. Let those guys stay with their very-rainbowy and non-SCM cpt. It is OK that they prefer that.
Esteban82
commented
1 year ago Hi @PaulWessel. About your post, I don't have much to say. It exceeds my knowledge. So I can't think of a better alternative. Maybe Walter can?
Count on me to reprocess the data.
joa-quim
commented
1 year ago I also find that CPT very bad, making seem that Venus has very steep holes at surface, but I'm with Paul. If they think it's nice.
PaulWessel
commented
1 year ago Hi @WalterHFSmith. Would you have time to weigh in on my lengthier comment above on down-sampling? Posted yesterday. I think I am right but will defer to a higher authority.
 WalterHFSmith
commented
1 year ago
WalterHFSmith
commented
1 year ago Hi, guys. So, do I understand, you are not proposing to alter how grdfilter works in general, but only proposing to alter the way that you downsample planetary relief grids? If the latter, I think you can do anything you like without consequence, and for "square" (Cartesian) calculations, the radius to the diagonal is probably a good idea. A more sophisticated idea would have to consider the spectrum of the output that can be handled without aliasing on the output mesh, and then designing the radius to give the desired spectrum. But it is hard to define all this properly on spheres and ellipsoids, etc etc. So the simple fix of the radius being the diagonal might work for this particular purpose.
PaulWessel
commented
1 year ago Yes, just the use of grdfilter, not tinkering with its code. Thanks, I think we will do the sort(2) since we treat everything as Cartesian in this special case. This should eliminate empty nodes and avoid aliasing, so it is an improvement I think as we search for perfection.
Esteban82
commented
1 year ago Testing again the planets with its own CPT. The CPT works fine. But it seems that something happend to the south pole of mercury.
gmt set GMT_DATA_SERVER candidate

gmt begin planets_defaultCPT png
    gmt subplot begin 2x3 -Fs5/0 -B+n -Rd -JQ5c
        gmt grdimage -c @mars_relief_30m
        gmt grdimage -c @mercury_relief_30m
        gmt grdimage -c @moon_relief_30m
        gmt grdimage -c @venus_relief_30m
        gmt grdimage -c @pluto_relief_30m
    gmt subplot end
gmt endI see the same. Shit, WTF. The file I created in staging works fine, but pulling it from candidate yields same as yours. Mine is 2 days younger than what is on candidate. I see these came from you? if you make a plot of the same file from your staging area do you get the same problem? If so you/me need to rerun make mercury-relief etc
Esteban82
commented
1 year ago I think that I got a problem when I process the grids. I am reruning.
PaulWessel
commented
1 year ago Hi @joa-quim and @Esteban82. Some issues with Sandwellʻs faaerror grid. The original file he shares says this
grav_error_32.1.nc: v_min: -7.80630970001 v_max: 58.2441101074 name: z
However, his file also reveals
grav_error_32.1.nc: Command: grdsample -R-180/180/-80/80 -I1m @GMTAPI@-S-I-G-G-G-N-000001 -Ggrav_error_32.1.nc -fg --GMT_HISTORY=readonly
which must mean he ran grdblend or something which then called grdsample. Anyway, pretty sure the uncertainty in an FAA node cannot be negative (probably cannot be zero either). So I think we should
Comments?
PaulWessel
commented
1 year ago @Esteban82, will you be able to redo Mercury or do you want me to do it?
Esteban82
commented
1 year ago @Esteban82, will you be able to redo Mercury or do you want me to do it?
Yes, it is being copied right now.
Esteban82
commented
1 year ago Mercury fix!
PaulWessel
commented
1 year ago Great, thanks! Maybe you can approve https://github.com/GenericMappingTools/gmtserver-admin/pull/242 which I wrote just to count the number of files on staging or on the server. i think all files are there.
PaulWessel
commented
1 year ago Maybe your plot of 5 should be made into a script in remote_data but also do all the earth files. It will be 22 I think. Ideally a script that detects the number of data and loops over them. Since this is 01d (I guess) it will be quick.
I wanted to have a second look at the MSS and now in my flooded inbox and 50 web tabs I cannot find the message from you with the links to the two candidates(french and IGPP). Please resend or point out the git page.
PaulWessel
commented
1 year ago Also, any other global images we should consider, e.g., land classifications? We would treat them the way we do day and night.
I made this script to test the new relief grids in the test directory. For all the grids I use the geo cpt.
I made a different issue so it is easy to find.