Closed maxrjones closed 3 years ago
Here's the hackmd file: https://hackmd.io/i4XjR4PxSn6ZTrtkAcA-5A. I will expand the description section after we finalize the session decision (more info below). In the meantime, collaborating authors can add themselves.
I left the 'decide on a session' task unchecked because the session descriptions have changed since we first discussed on the GMT Forum. In particular, the open science in action session is now more limited in duration. I asked for clarification about the three different sections (oral presentation, tutorial, and e-Lightning) and found out that the conveners are only soliciting abstracts for the e-Lightning section.
- Open-source software for near-surface geophysics and its applications
near-surface geophysics only focus on the top few kilometers of the Earth. I'm afraid PyGMT is rarely used in this area and won't get much attention.
- Open Science in Action (eLightning only)
- Open-source software, notebooks, and FAIR software
Both sessions look good to me. As I understand them, the "Open Science in Action" seems to focus on "open science workflows" rather than "open-source software". So I prefer the "Open-source software, notebooks, and FAIR software".
Agree with @seisman that either of the "Open" sessions will do (note that these are both virtual only sessions). It's a pity that we can't do a tutorial, so I guess it comes down to the session format? Do you know if both "Open" Sessions are e-Lightning ones @meghanrjones? (Edit: I've asked at https://discourse.pangeo.io/t/jupyter-pangeo-open-science-connected-sessions-at-agu-2021/1667/4, will see if they reply).
FYI to others, the e-Lightning session involves a quick 3 min presentation followed by a digital poster discussion session (total of 75-min) according to https://www.agu.org/Fall-Meeting/Pages/Present/Abstracts/Session-Formats, see also last year's link at https://www.agu.org/Fall-Meeting-2020/Pages/Present/Presenter-Guidelines/eLightning-Guidelines-Before-Meeting for details.
I am not sure about the format for the IN030 session, but I would guess that it's likely to have some more standard poster/oral presentation assignments. I would prefer to submit to the Open source software, notebooks, and FAIR software session, similar to @seisman.
Complete draft for the main text is now posted on hackmd. I moved ObsPy integration to future plans in case we do not complete the task before AGU. I still need to add plain language summary and an image showing off PyGMT's map making skills.
Any ideas for the abstract image? If someone has a general concept, I can try and code one up. I.e. do we want a cool image like the background in https://doi.org/10.6084/m9.figshare.6399944.v1, a logo-like image, or a gallery example-like image? Thoughts?
Maybe we could put 4 or 6 exemplary gallery plots together into one via subplots? E.g.
plot1 | plot2 plot3 | plot4
However, I would also like the idea of a huge background image.
I like the idea of a cool image similar to the background of Leo's poster. I had been trying to make a nice figure showing Arctic Landsat imagery, but ran into some problems related to https://github.com/GenericMappingTools/pygmt/pull/370. My motivation for working with false color images was to try to draw in more people outside the geophysics community (which are most likely to already know about GMT and the wrappers). But, velocity fields and/or focal mechanisms are also always fun 😄
Pinging @PaulWessel and @leouieda in case you would like to add yourselves to the PyGMT AGU abstract here: https://hackmd.io/i4XjR4PxSn6ZTrtkAcA-5A (or comment here for me to add you if needed).
Thank, @meghanrjones! I´ll give the abstract a read tomorrow and see if I have anything to add.
Just FYI about the sessions, the near-surface one is part of that division mostly because we had to choose a division and most of the primary convenors were from near-surface back in 2018 when we first put it together. But it's always had submissions from across geoscience. That said, "Open-Source Software, Notebooks and FAIR Software" is also a great fit and I agree that it's a good home for this abstract.
I had been trying to make a nice figure showing Arctic Landsat imagery, but ran into some problems related to #370. My motivation for working with false color images was to try to draw in more people outside the geophysics community (which are most likely to already know about GMT and the wrappers).
@djhoese may be interested in giving this a try (I think you asked about this at a Scipy but my pre-covid/pre-baby memory is spotty).
I like the idea of a cool image similar to the background of Leo's poster. I had been trying to make a nice figure showing Arctic Landsat imagery, but ran into some problems related to #370. My motivation for working with false color images was to try to draw in more people outside the geophysics community (which are most likely to already know about GMT and the wrappers). But, velocity fields and/or focal mechanisms are also always fun smile
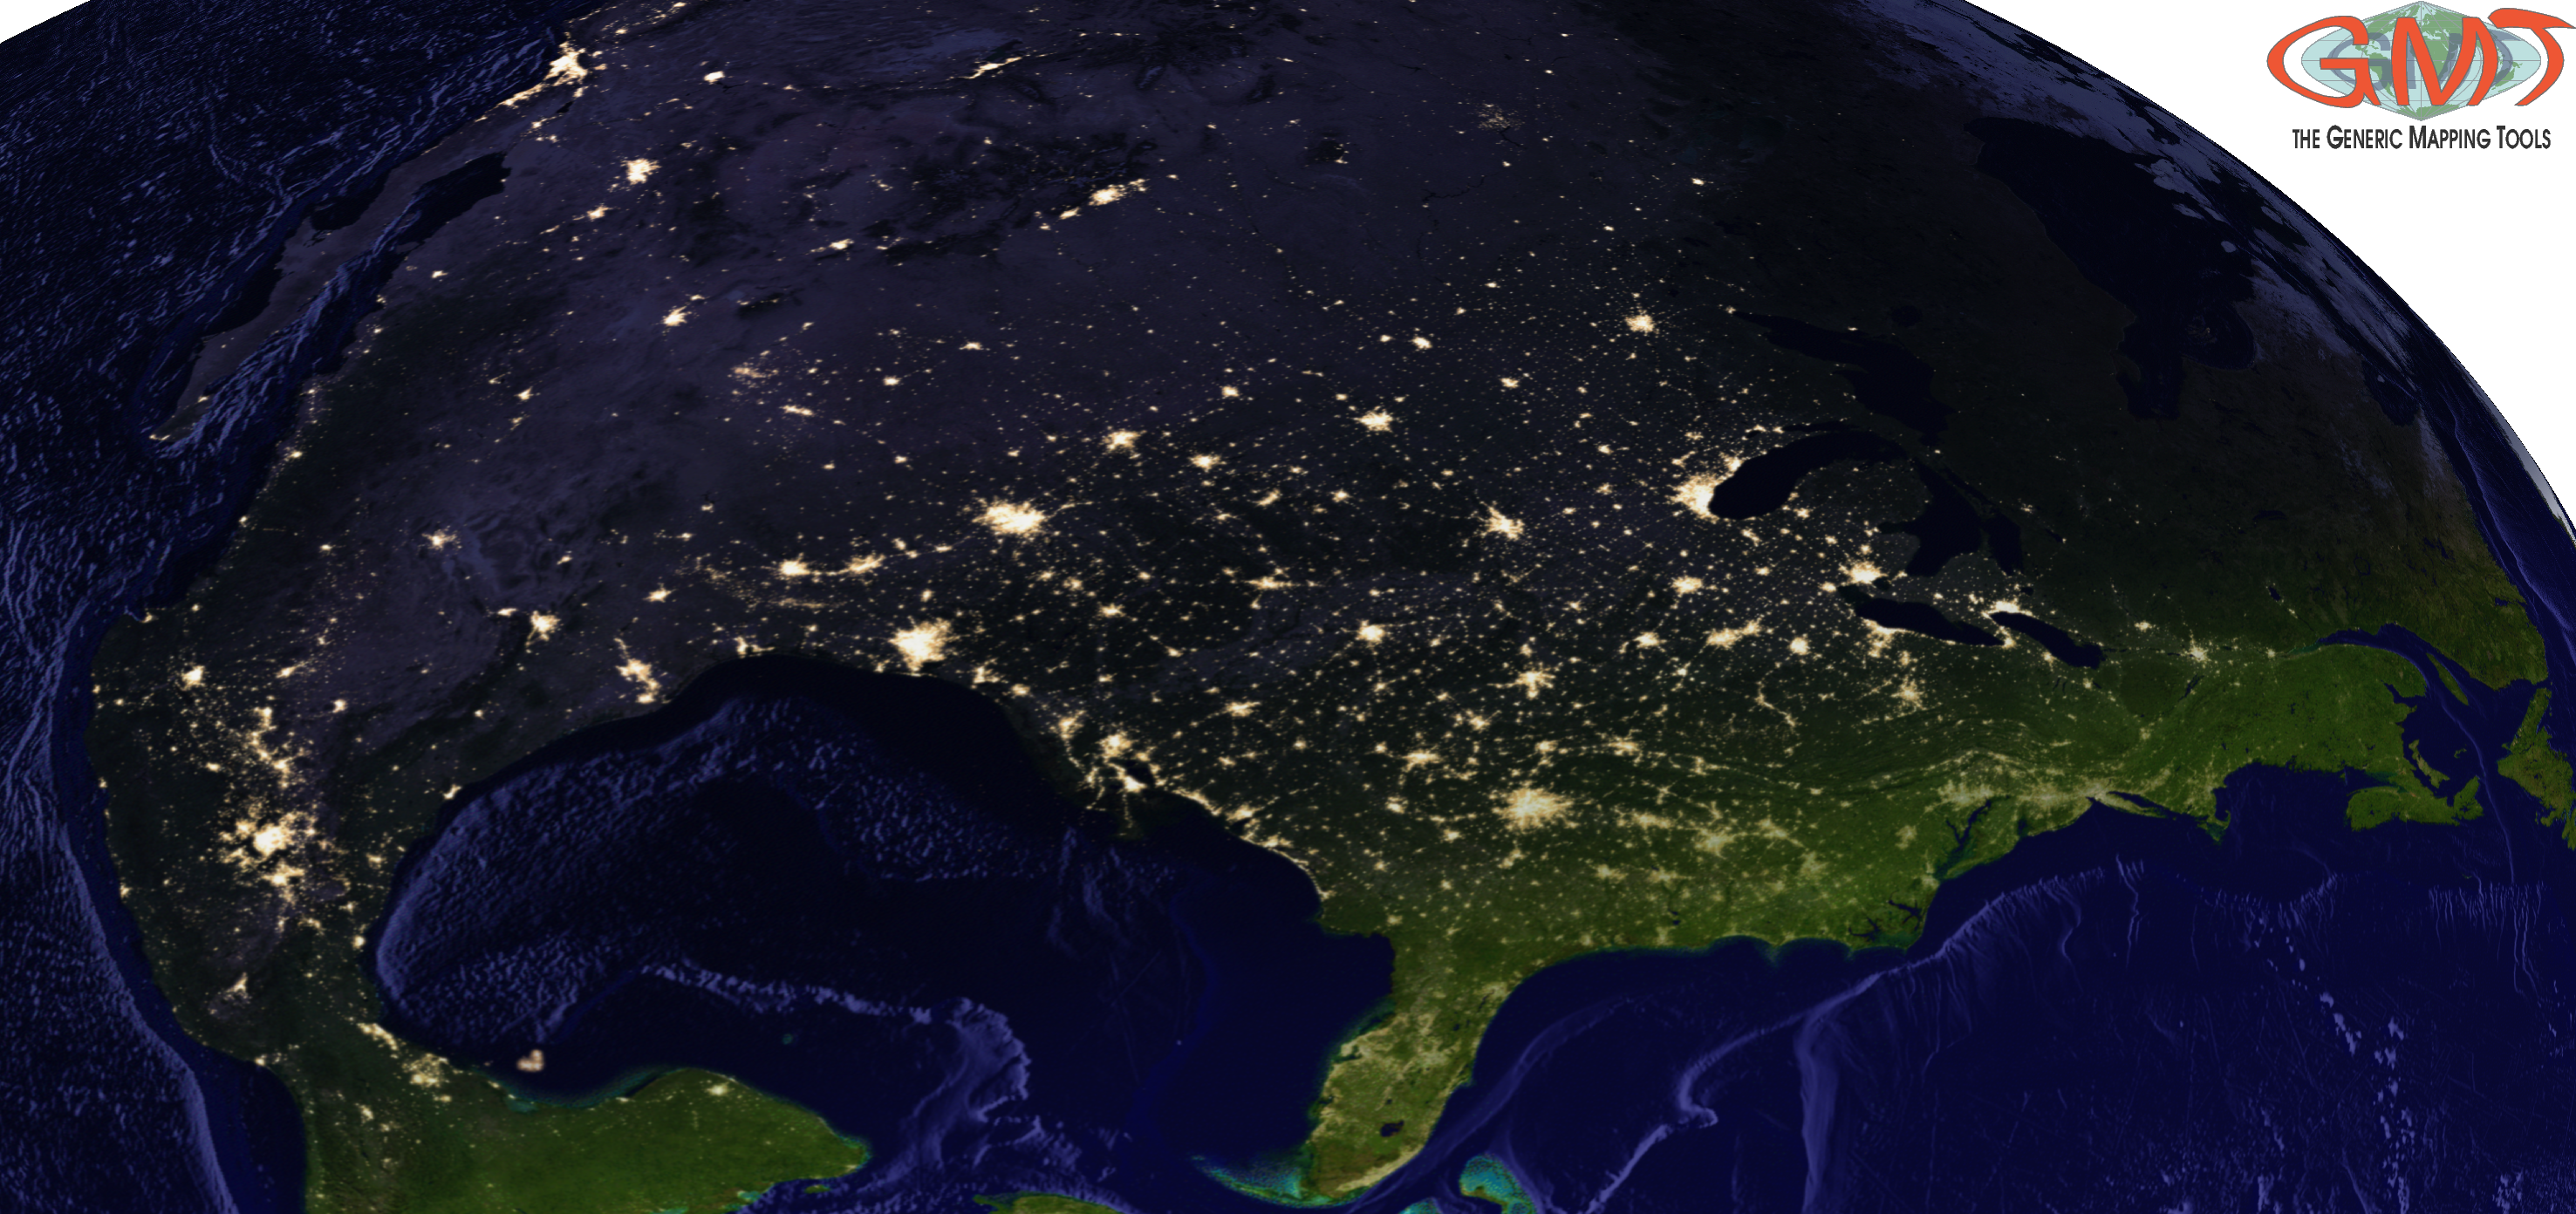
Another option would be using the NASA day-night images at https://docs.generic-mapping-tools.org/6.2/datasets/remote-data.html#global-earth-day-night-images, tweaking https://docs.generic-mapping-tools.org/latest/gallery/ex52.html. Maybe work out a good General Perspective -JG
view with some good fig.solar
code to blend day and night? But how to make it look GMT-like without being just a cool satellite image?
But how to make it look GMT-like without being just a cool satellite image?
Overlay some contours of data on top of it? Like gravity or something else that is relatively smooth.
Maybe work out a good General Perspective
A view of New Orleans would fit in nicely with the event and gets some of the continent and ocean.
Cheating a little bit with pure GMT, but I've worked out the General Perspective projection over New Orleans at least:
Code as below, feel free to tweak or build on top of it, I haven't decided what layers to overlay on top :slightly_smiling_face:
import pygmt
res = "05m" # 5 arc minute resolution
# Use the location of the Sun at 6.30am (sunrise) on 13 Dec 2021, Central Standard Time (UTC-6)
!gmt solar -C -o0:1 -I+d2021-12-13T06:30+z-6 # -8.95331142671 -23.1626971083
# Make a global grid with a smooth 2-degree transition across day/night boundary.
!gmt grdmath -Rd -I$res -r -8.95331142671 -23.1626971083 2 DAYNIGHT = w.grd
# We will create an intensity grid based on a DEM so that we can see structures in the oceans
pygmt.grdgradient(grid=f"@earth_relief_{res}", N="t0.5", azimuth=45, outgrid="intens.grd")
# Blend the earth_day and earth_night geotiffs using the weights, so that when w is 1
# we get the earth_day, and then adjust colors based on the intensity.
!gmt grdmix @earth_day_$res @earth_night_$res -Ww.grd -Iintens.grd -Gview.tif
# %%
fig = pygmt.Figure()
# Plot this image on an Earth with view from over New Orleans Ernest N. Morial Convention Center
fig.grdimage(
grid="view.tif",
# General Perspective lon0/lat0/altitude/azimuth/tilt/twist/Width/Height/width
projection="G-90.0631825/29.9395386/3000/345/10/-30/90/60/25c",
)
fig.logo(position="jTR+w3c")
fig.savefig(fname="agu2021_pygmt.png")
fig.show()
Abstract is really good! Left a comment about adding a sentence or two about the community side of things, not only the technical. I think PyGMT has a lot to share about that.
That's great, thanks @weiji14! I just tweaked slightly to only use the illumination over the ocean and upped the resolution a bit:
import pygmt
res = "02m" # 2 arc minute resolution
# Use the location of the Sun at 6.30am (sunrise) on 13 Dec 2021, Central Standard Time (UTC-6)
!gmt solar -C -o0:1 -I+d2021-12-13T06:30+z-6 # -8.95331142671 -23.1626971083
# Make a global grid with a smooth 2-degree transition across day/night boundary.
!gmt grdmath -Rd -I$res -r -8.95331142671 -23.1626971083 2 DAYNIGHT = w.grd
# We will create an intensity grid based on a DEM so that we can see structures in the oceans
pygmt.grdgradient(grid=f"@earth_relief_{res}", N="t0.5", azimuth=45, outgrid="intens.grd")
# Mask so that the DEM-based intensity is NaN on land
!gmt grdmath @earth_mask_$res 0 EQ 0 NAN intens.grd MUL = intens_ocean.grd
# Blend the earth_day and earth_night geotiffs using the weights, so that when w is 1
# we get the earth_day, and then adjust colors based on the intensity.
!gmt grdmix @earth_day_$res @earth_night_$res -Ww.grd -Gview.tif -Iintens_ocean.grd
# %%
fig = pygmt.Figure()
# Plot this image on an Earth with view from over New Orleans Ernest N. Morial Convention Center
fig.grdimage(
grid="view.tif",
# General Perspective lon0/lat0/altitude/azimuth/tilt/twist/Width/Height/width
projection="G-90.0631825/29.9395386/3000/345/10/-30/90/60/25c",
)
fig.logo(position="jTR+w3c")
fig.savefig(fname="agu2021_pygmt.png")
fig.show()
Submitted! Thanks for all your contributions on the abstract!
Description of the desired feature
We decided to submit a PyGMT AGU abstract in a discussion on the GMT Forum; I am opening this issue to track progress and to host PyGMT specific discussions before the August 4 deadline.
Link to abstract: https://hackmd.io/i4XjR4PxSn6ZTrtkAcA-5A
Tasks: