Hi @Santosh-Kumar-Perumal,
-
The collector will not be storing the metrics. I haven't used
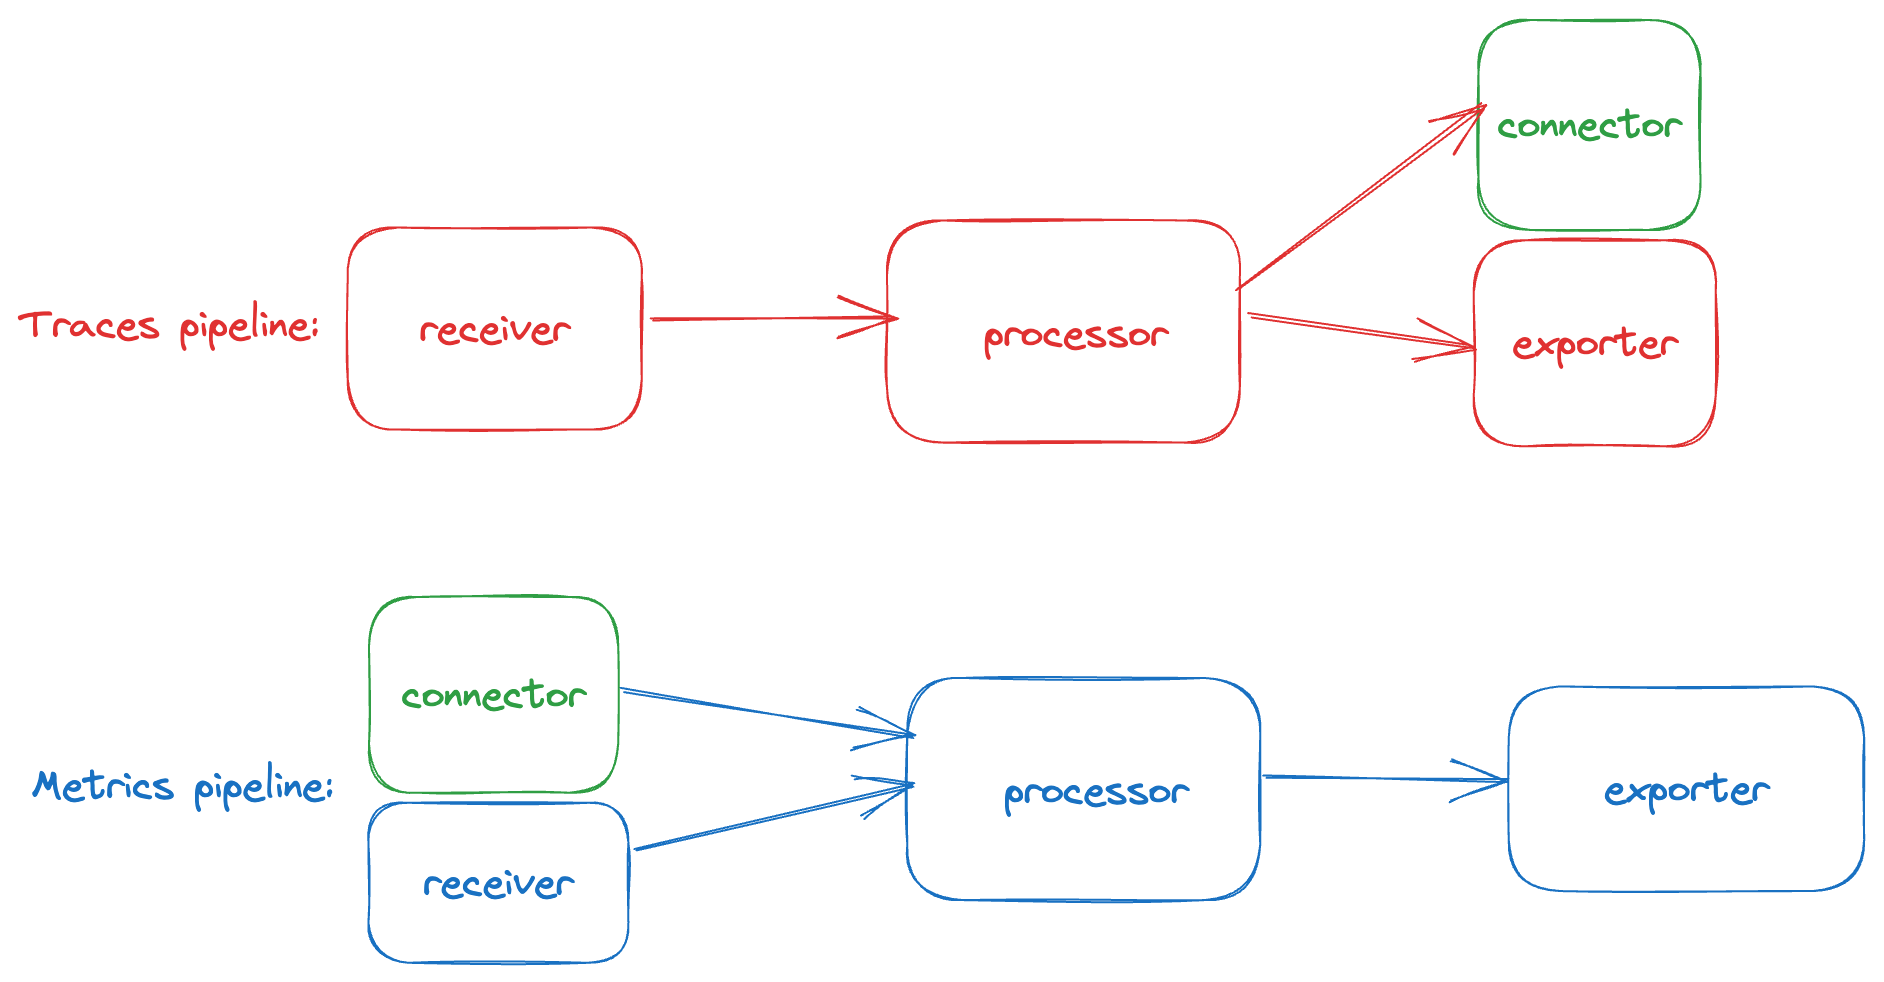
spanmetrics connectorbefore, but IIUC, this acts both as a exporter and receiver. So from the traces pipeline the connector acts a an exporter - exporting the metrics as per your config. Then in the metrics pipeline, this connector acts as a receiver for those trace metrics and they end up wherever your metric pipeline is configured to export them. The following image might clarify the process:
-
If you export trace spans to BigQuery, I don't think you would require an extra function to convert them into "Cloud Monitoring Metrics" if you only want to visualize them in a dashboard. There is a Logs Analytics Widget that lets you chart BiqQuery queries - so this could possibly fit your use-case.
Hi Team,
I have my java application running on GKE instrumented with Open Telemetry auto instrumentation and the traces are exported to cloud trace using google exporter-auto-0.28.0-alpha-shaded.jar I am happy with the trace and spans able to see them in cloud trace.
Now I am looking for options to extract metrics out of the spans that I see in cloud trace spans like the latency, response time etc. into useful charts in Cloud monitoring any suggestion on how to get metrics out of cloud trace spans this would really help.
Something that I can explore from metric explorer for cloud trace and then create charts for the metrics that I see in spans is what I am really looking at as I can see I don't see any metrics which GCP pulls by default from cloud trace.
When I searched, I see lot of options
References https://github.com/open-telemetry/opentelemetry-collector-contrib/blob/main/connector/spanmetricsconnector/README.md
@psx95 please throw some light on this.