 ritchiecarroll
commented
6 years ago
ritchiecarroll
commented
6 years ago What exactly would you like to know about performance?
Closed zhouyijiaren closed 5 years ago
ritchiecarroll
commented
6 years ago What exactly would you like to know about performance?
 saelwahid
commented
5 years ago
saelwahid
commented
5 years ago Hi I was able to connect to the PMU in SEL-421 relay using the pmu connection tester, but I wasn't able to connect the open historian 2, its giving me this error (connection attempt failed) would you please show me the right steps to add a new input device, I tried the synchrophasor walk through wizard but nothing changed
ritchiecarroll
commented
5 years ago (1) If you have successfully connected with PMU Connection Tester, you can save the connection information into a file by selecting "File > Connection > Save..." from the main menu:

By default this will create a file with an extension of ".PmuConnection" - this is an XML file that contains the connection information you used in PMU Connection Tester to connect to your PMU.
(2) Now, from the "openHistorian Manager" - the desktop application, not the web app - click on the "Input Device Wizard" button on the home page (or navigate to "Inputs > Synchrophasor Device Wizard" from the main menu):
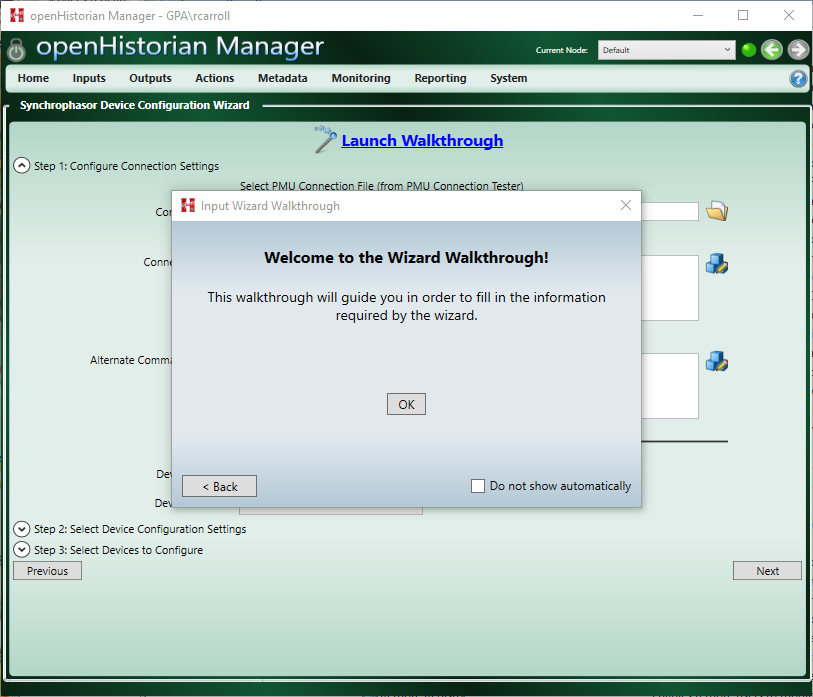
(3) Click "OK" on the "Welcome to Wizard Walkthrough!" front page and answer "Yes" to the "Have you tested your device's connection settings using the PMU Connection Tester?" question. Also answer "Yes" to "Do you have a connection file from the PMU Connection Tester" question.
(4) You should now be on a screen that says "Please enter the path to the connection file from the PMU Connection Tester." - from here click on the "Browse" button and select the ".PmuConnection" file you created in step (1):

(5) Click "OK" once the file has been selected and the click "Yes" in response to "Would you like the wizard to attempt to make this connection?". On the next screen click "Request Configuration" to attempt the connection to the device.
(6) Assuming the connection is successful, provide any ancillary requested information on the next one or two screens and click "OK" on each - then on the final wizard screen click "Finish":

(6) Now clicking "Finish" on the bottom right of the screen will complete adding the device to the openHistorian. You can now navigate to the "Graph Measurements" screen to verify that data is flowing into the historian by clicking "Monitoring > Graph Measurements" from the main menu:

(7) Additionally, you should now find the data in the openHistorian web application ready for trending and export:


saelwahid
commented
5 years ago its still giving me the connection failed error

I attached the error message I had
What about the performance of the OpenHistorian?