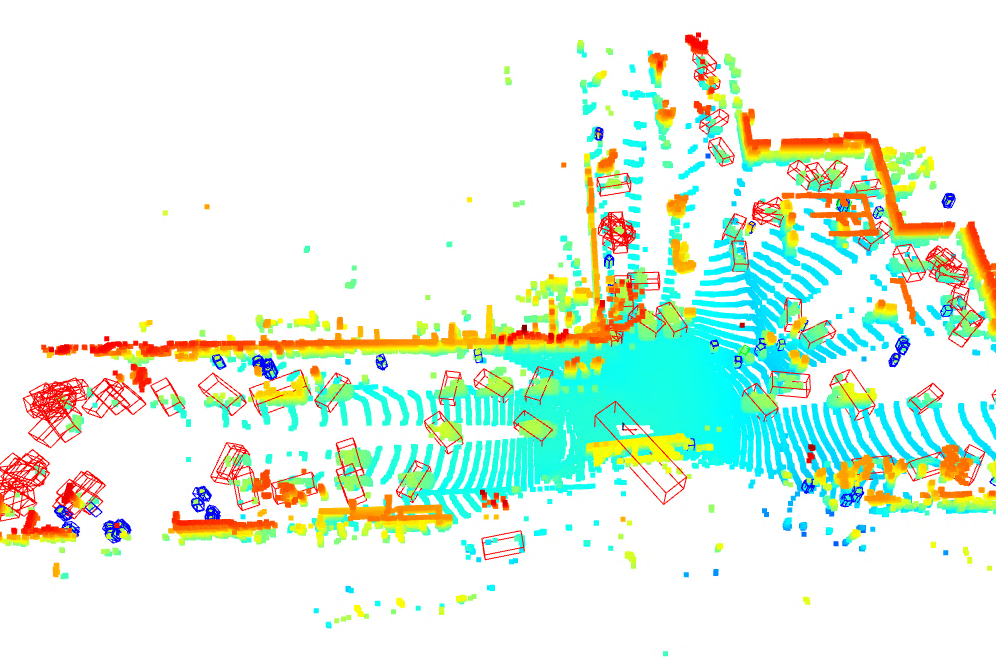
That's wired, can you check your det result in the .txt file to see if lwh is reasonable ?
Closed irmuun20 closed 1 year ago
That's wired, can you check your det result in the .txt file to see if lwh is reasonable ?
It seems like I was using a wrong method to translate rotation. The following fixes the issue. Thank you for your wonderful implementation.
entities_to_draw = []
for box in boxes:
    center_point = box[0:3]
    h, w, l = box[3], box[4], box[5]

    rotation = box[6]

    # Standard 3x3 rotation matrix around the Z axis
    rotation_matrix = np.array([
        [np.cos(rotation), -np.sin(rotation), 0.0],
        [np.sin(rotation), np.cos(rotation), 0.0],
        [0.0, 0.0, 1.0]])

    box3d = o3d.geometry.OrientedBoundingBox(center_point, rotation_matrix, [h,w,l])

    if box[-1] == 0:
        box3d.color = [1, 0, 0]           #Box color would be red box.color = [R,G,B]
    elif box[-1] == 1:
        box3d.color = [0, 0, 1]
    else:
        box3d.color = [0, 1, 0]
entities_to_draw.append(box3d)Now rotation seems in inverse.

is this correct data output from centerpoint? rotation is relative to z axis?
[center_x, center_y, center_z, rotation_z, length, width, height]
No,the output format in each line is x,y,z,l,w,h,vx,vy,rot,score, class, check here
I also provide visualization code, you can take it as reference ~
I checked that you output radian value for rotation as follows: https://github.com/HaohaoNJU/CenterPoint/blob/7728be92e118e633602b8c2d96a5f955d03dec99/src/postprocess.cpp#L194
but when I convert it into degree, it yields still incorrect results
degree = radian*(180/pi)

Finally fixed the issue by setting rotation to negative value:
entities_to_draw = []
for box in boxes:
    center_point = box[0:3]
    h, w, l = box[3], box[4], box[5]

    rotation = -box[6]

    # Standard 3x3 rotation matrix around the Z axis
    rotation_matrix = np.array([
        [np.cos(rotation), -np.sin(rotation), 0.0],
        [np.sin(rotation), np.cos(rotation), 0.0],
        [0.0, 0.0, 1.0]])

    box3d = o3d.geometry.OrientedBoundingBox(center_point, rotation_matrix, [h,w,l])

    entities_to_draw.append(box3d)
Helloo ,
Can you send me the script you have used for visualization , I try to test on ouster lidar data and I have seen that you have done the same so can you please provide me with the script of visualization and how you have handled intensity and elongation values
Thank you in advance
I want to test your model on the sample
bindata you provided in the repo. I am trying to visualize the prediction boxes using open3d library but boxes seem incorrect such that person box in blue color is lying horizontally like car while car boxes in red color is displayed correctly. I used the following code to visualize results:I will appreciate it if you provide a feedback on this issue. Thank you.