 antdambro
commented
12 years ago
antdambro
commented
12 years ago Sorry, weather charts of course
Open antdambro opened 12 years ago
antdambro
commented
12 years ago Sorry, weather charts of course
 powder96
commented
12 years ago
powder96
commented
12 years ago Wheater charts Sorry, weather charts of course — antdambro
There is an edit button you can use to fix typos.
I do not know what these weather charts look like. Look through these examples: http://www.humblesoftware.com/flotr2/ , maybe you will find the one you need.
antdambro
commented
12 years ago Wind bars are used to show the speed and direction of wind at a point in the space and in the time. Wind rose is used to show main directions and speeds of wind in a period of time. I have just viewed examples at http://www.humblesoftware.com/flotr2/., radar chart looks like a wind rose. Examples of wind barb: http://www.ncl.ucar.edu/Applications/Images/barb_4_lg.png Example of wind rose: http://or.water.usgs.gov/grapher/tutorial/examples.html Bye
 cesutherland
commented
12 years ago
cesutherland
commented
12 years ago Ok that's a pretty cool graph. Do you have an example for what the data looks like?
I count 5 dimensions:
antdambro
commented
12 years ago Well, speed and direction of wind are usually measured as:
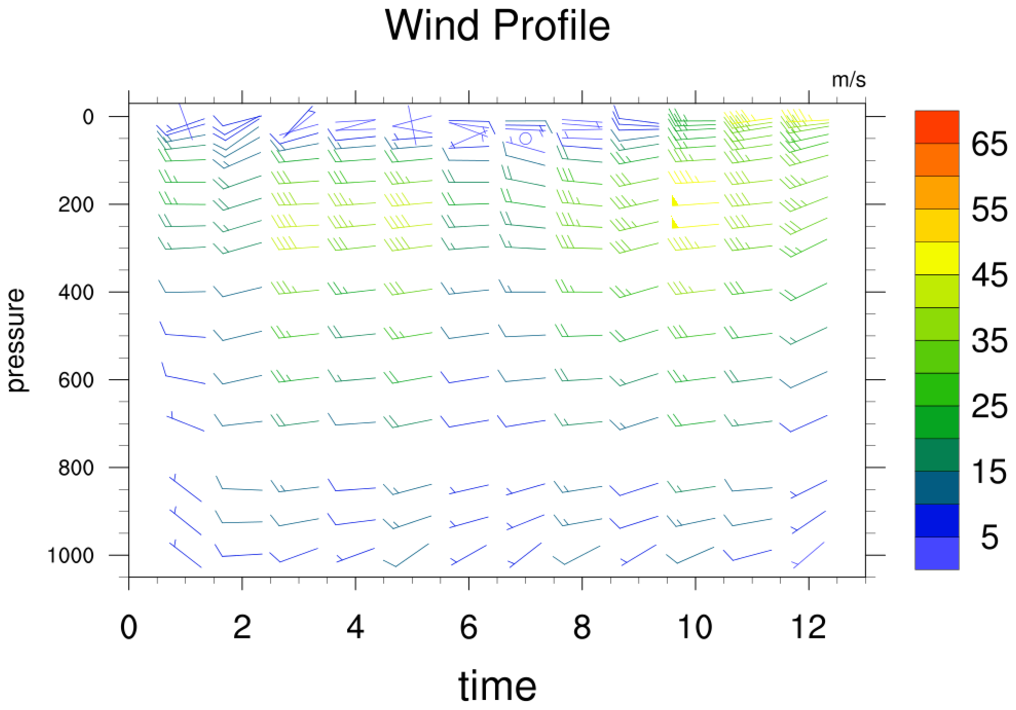
The graphic at http://www.ncl.ucar.edu/Applications/Images/barb_4_lg.png is composed by x axis: time, y axis: air pressure in hPa (hectopascals) wind barbs oriented along wind's direction and graphically rendered using the scale at http://www.weatheronline.co.uk/marine/weather?133&LANG=en&WIND= (here unit of measurement is knots, please visit http://en.wikipedia.org/wiki/Knot_(unit)), legend on the right side that shows wind's speed in m/s, so wind barbs are rendered according scale conversion from knots to m/s (responsibility of the user).
An example of data is:
12:00, 500, 6, 45 12:00, 700, 2, 180
The first is a wind with speed 6 m/s from NE at 12 o'clock, 500 hPa The second is a wind with speed 2 m/s from S at 12 o'clock, 700 hPa
In general air pressure on the y axis can be replaced as height from ground.
I hope flotr2 will be able to represent a single couple <wind's speed in knots, wind's direction in degree> as a wind barb with the appropriate number of barbs and direction. Wind barb color is an attribute that user can modify according a scale. The measuremnt's units on x axis and y axis are chosen by the user, so that wind 's barb is only a special case of xy charts where single points are not showed: a point is replaced by a wind barb.
cesutherland
commented
11 years ago I dig the charts but haven't had the opportunity to implement this myself.
If anyone wants to try it, please check https://github.com/HumbleSoftware/Flotr2/tree/master/js/types for example chart types.
Hi, I'd like to plot wind barbs and wind rose. Do you thing is it possible in new release of this library ? Thank you very much.
Great job!