IALSA / IALSA-2015-Portland

Hub to accompany IALSA 2015 workshop at Portland, OR, Feb 22-25, 2015
GNU General Public License v2.0
2 stars 0 forks source link

Table 3: MES graph #49

Open andkov opened 9 years ago

andkov commented 9 years ago

Using the imagery and naming described in model specification create a graph that plots the predicted values of the selected models from gamma estimates:
proto MES

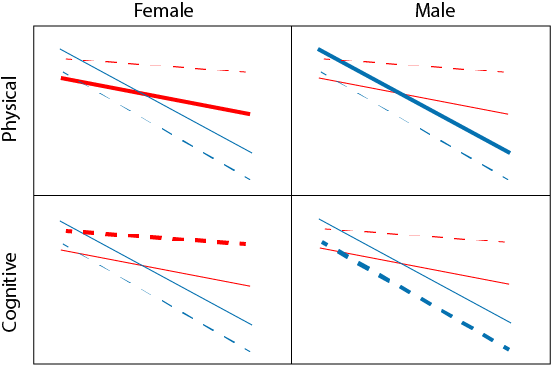
In which each line is defined by the GAMMA elements. For example, the line for physical and male would be computed as: y = pp_GAMMA_00 + pp_GAMMA_11(TIME)

One graph = two bivariate models (female, male). The selections for the models should(?) be: study, phys measure, cog measure, and model type. This graph will occupy one of the tabs on the DASHBOARD

UPDATE:

wibeasley commented 9 years ago

I'll call you in a little bit about the data source (which directory and which files).

This if it ever makes sense in future version for those slopes and parameters to be manipulated (kinda like these sliders indirectly do for the bottom left graph). http://shiny.ouhsc.edu/SdtThreshold/ image

andkov commented 9 years ago

Yes. For example, instead of the Diseased Mean slider we would have a slider with categorical values (0)--(a) --(e)--(h)--(+)--(f) counting model_type. The predictors in model_type is a bit tricky because they can be could be represented by a several variables, like (e):(education) : highschoolgrad: yes/no, collegegrad: yes/no. That's what some of the models look like and i think we should at least try to accommodate such complexity because it might be useful later.

Crazy idea: what if we create a long discrete slider to go inside the dashboard tab. That long vertical (?) discrete slider will list the cognitive measure, the long dimension. The short dimension (physical measure) could still be operated from the dashboard sidebar. This way we'll give a fast way of flipping through the models.

andkov commented 9 years ago

@wibeasley , the genealogy of the data can be surveyed in ./scripts/README.md. As the rule of thumb, datasets are stored in ./data/shared/, the number indicates temporal position in the workflow (So ds2 is older, more "ready" than ds1).

All graphs, reports, and apps begin with ds2.rds.