 andkov
commented
8 years ago
andkov
commented
8 years ago @bpmulligan: Quality control of results - false positive are less costly false negatives.
Open andkov opened 8 years ago
andkov
commented
8 years ago @bpmulligan: Quality control of results - false positive are less costly false negatives.
 beccav8
commented
8 years ago
beccav8
commented
8 years ago Today was very informative! Although I am new to this type of analysis I can see how efficient and simple this will make coordination and can't imagine the complications that arise without this type of system in place. Andrey's explanation of bivariate growth curve modeling was concise and comprehensible. I found the README file to be useful to consult for the basic formula. Moreover, the graphical display of the overlapping variables provided an easy visual to see how studies overlap, and potential for coordinated models.
Thanks for the invite today!
 ghost
commented
8 years ago
ghost
commented
8 years ago Thanks, Rebecca, for voicing all of that. I echo all of it and honestly would not have much to add. Certainly helped being facile with RStudio. The majority of issues I was having were OS-related. Particularly, it was complicated by the fact that I was running a very minimized OS that did not have a lot of basic software packages that would be found on a typical install of Linux. Although I could run R and RStudio without issue, my system was not equipped to run the packages required by the "stencil" scripts. I like Will's suggestion of creating a system-check/package installation script for folks to run before arriving at the workshop.
Keep us all posted on the progress!
-Bryce.
On 16-05-26 09:39 PM, Rebecca wrote:
Today was very informative! Although I am new to this type of analysis I can see how efficient and simple this will make coordination and can't imagine the complications that arise without this type of system in place. Andrey's explanation of bivariate growth curve modeling was concise and comprehensible. I found the README file to be useful to consult for the basic formula. Moreover, the graphical display of the overlapping variables provided an easy visual to see how studies overlap, and potential for coordinated models.
- At the end of the tutorial, what stood out most was the random and fixed effects tables and how these tables related back to the formula. This made understanding the output very clear.
From what I gather, the user will have to navigate between R and MPlus to use this software. I was not familiar with MPlus, but running the .inp files was mindless (which I'm sure has pros and cons). Given the ease of use, the program makes such complex analyses easy to use and available to a greater population than would be the case otherwise.
- Despite this, I can see where users can get confused if they are unfamiliar with R. There was a lot more shuffling around through the rstudio environment. Lastly, the Pre-survey questionnaire included all the essential information, but was difficult to navigate at times. Specifically, the cognitive variable section. Perhaps a drop down menu where the user could select the variables they have in their data, and then only respond to questions on these variables would be simpler (if possible)? Alternatively, including all the cognitive variables on the same page as discussed could allow the user to search (cntr. F) for their variables. Or, based on the study they select on page 1, perhaps only variables we know are available to them would appear? (just brainstorming). 3.Providing future users with a guideline (like what was written on the bored) would be useful. I think with proper instruction the program is very simple, especially if the user is familiar with both MPlus and Rstudio.
Thanks for the invite today!
— You are receiving this because you were mentioned. Reply to this email directly, view it on GitHub https://github.com/IALSA/ialsa-2015-portland-stencil/issues/49#issuecomment-222058697, or mute the thread https://github.com/notifications/unsubscribe/AKSKfwUNw-lgeNCBgDUdZ_izCXeAS4_-ks5qFnWFgaJpZM4In-7U.
Bryce P Mulligan Clinical Psychology Doctoral Student (Neuropsychology Specialization) Neuropsychology & Rehabilitation Laboratory Department of Psychology P.O. Box 1700 University of Victoria Victoria BC Canada V8W 2Y2 250-472-4194 bpm@uvic.ca
 raquelgraham
commented
8 years ago
raquelgraham
commented
8 years ago Rebecca and Bryce have made some great points, and I also agree with most of them. Here are some additional thoughts.
Thanks again for including me in testing the software. I look forward to seeing how it continues to develop.
Raquel
 wibeasley
commented
8 years ago
wibeasley
commented
8 years ago Thanks @beccav8, @raquelgraham, @bpmulligan. We read and appreciated all your comments. (@andkov is running errands for the party tonight, but I'm sure he'll respond later by himself.) Thank you again for attending yesterday and giving us valuable & thoughtful perspectives.
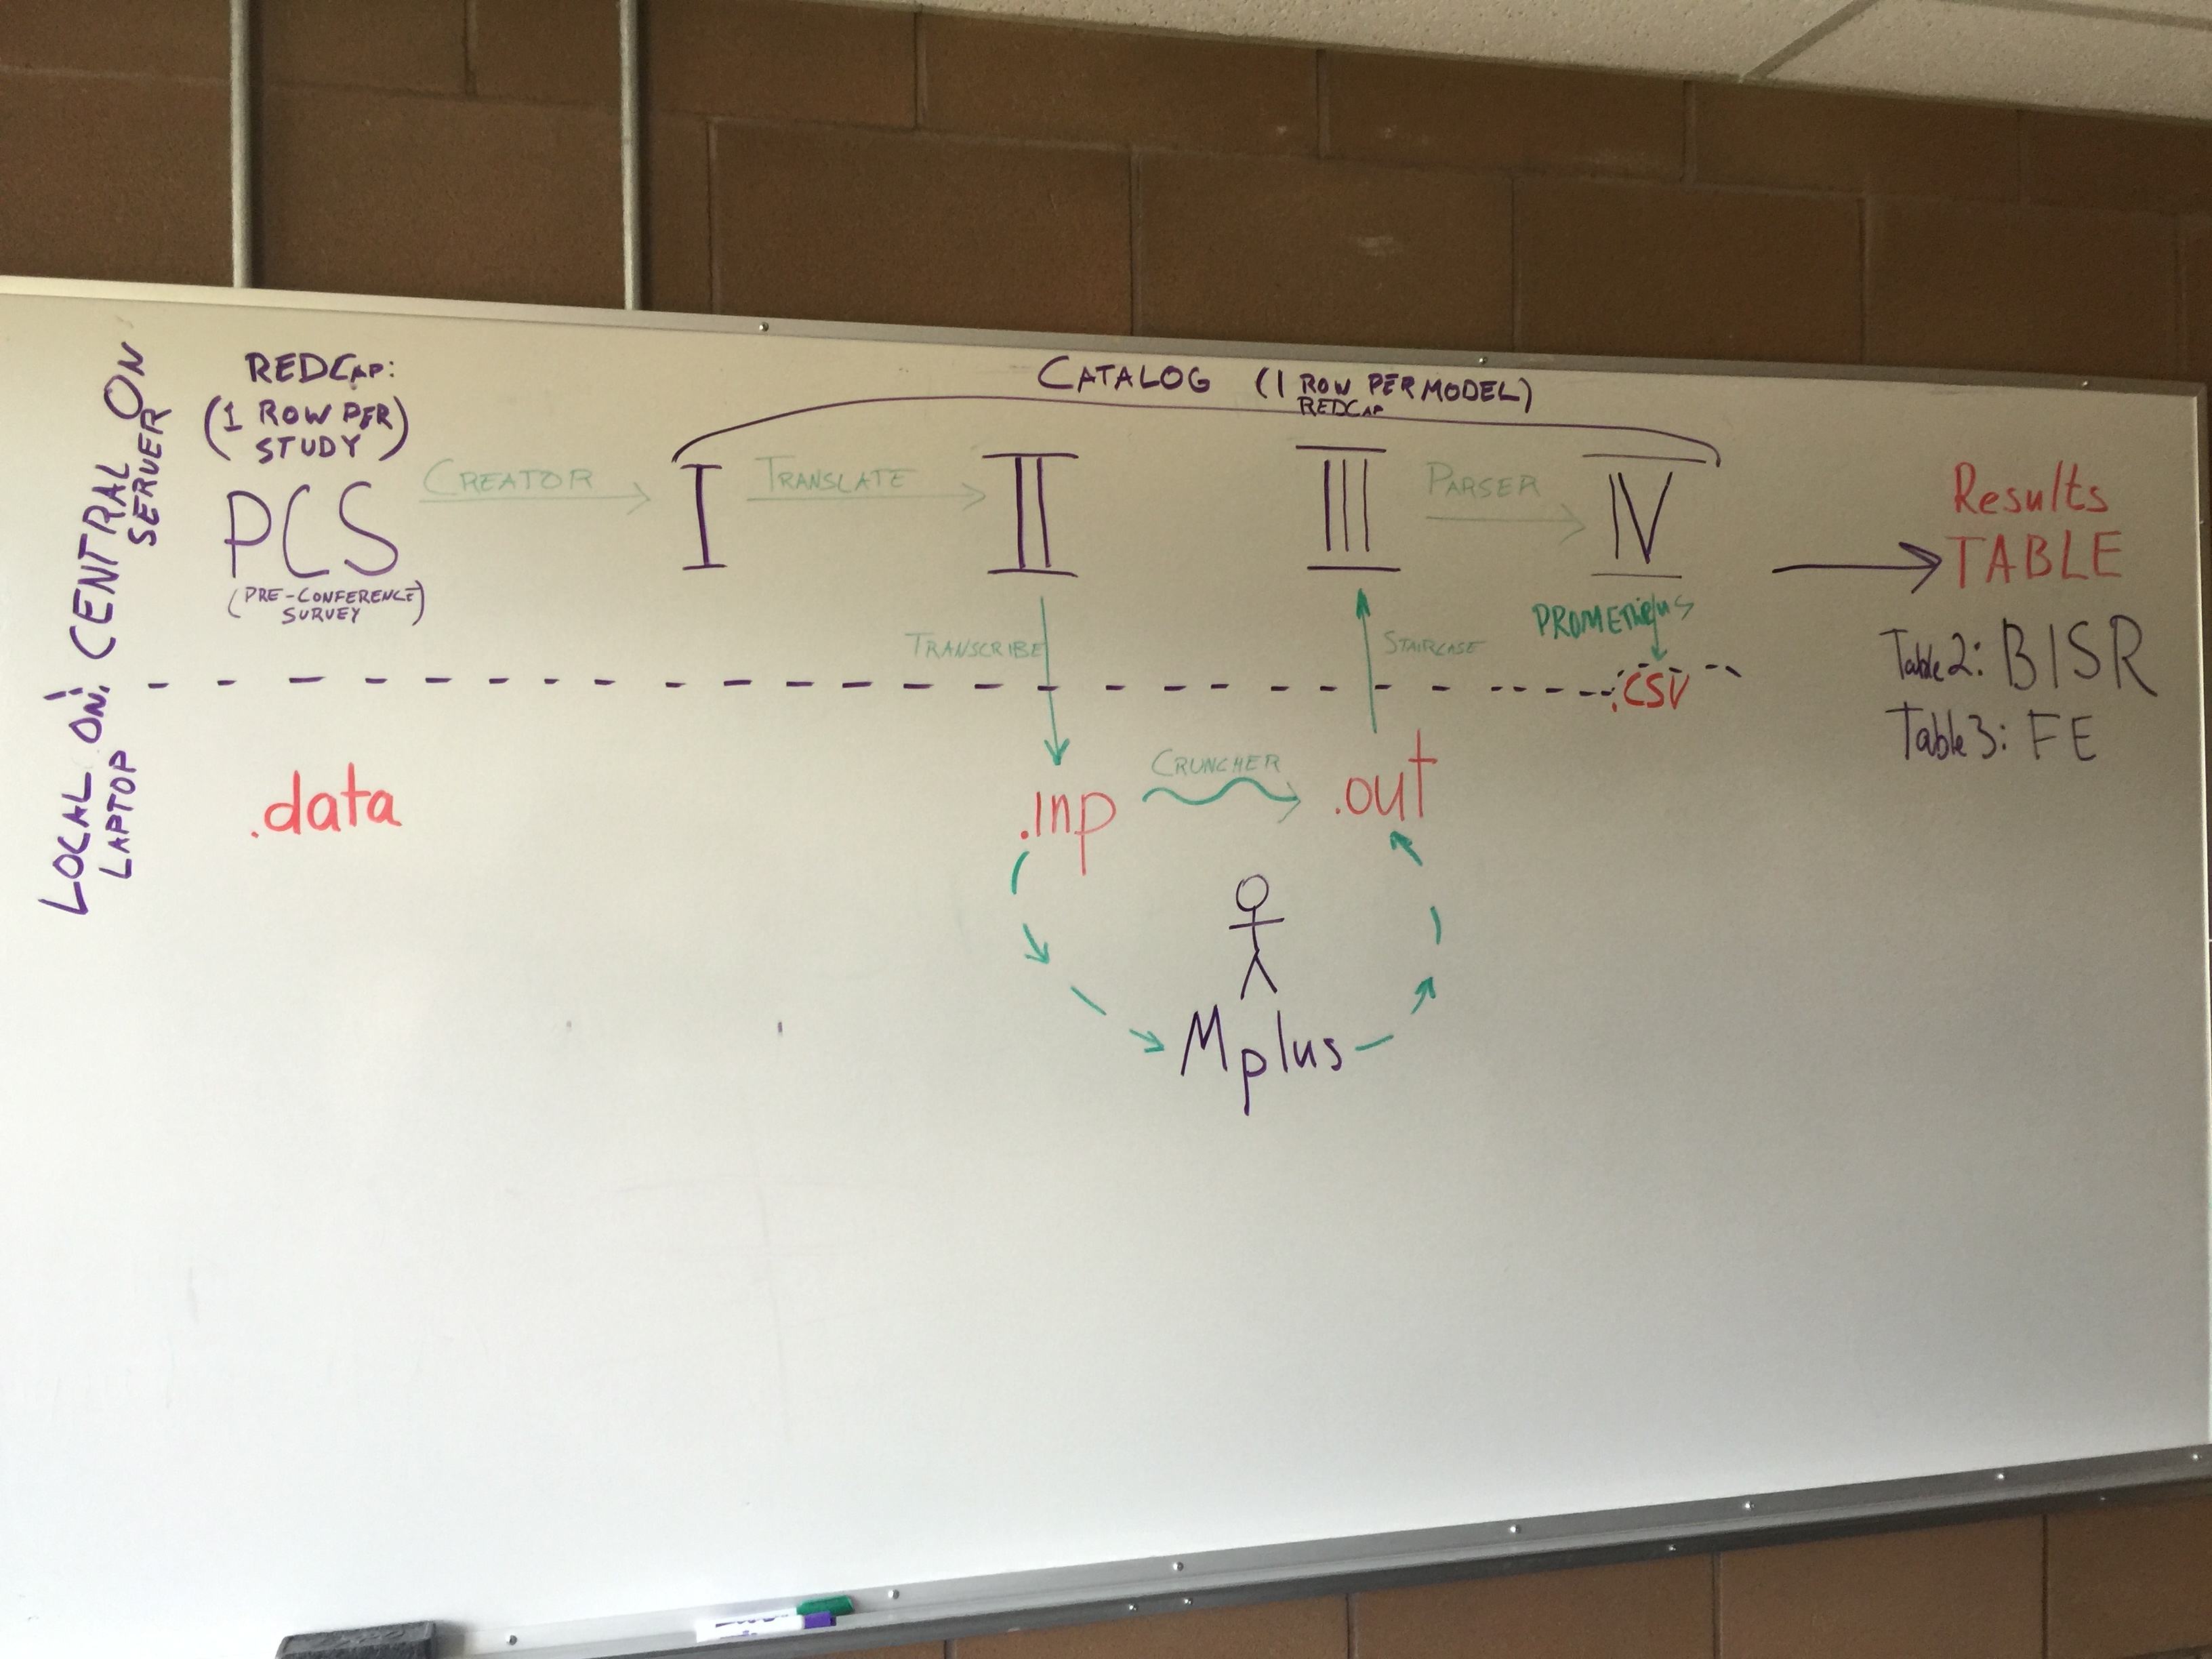
I'm posting individual responses to the three of you. Here's yesterday's workflow image for reference.
wibeasley
commented
8 years ago (These and other responses are being documented in a repo file too.)
@beccav8:
I can see where users can get confused if they are unfamiliar with R. There was a lot more shuffling around through the rstudio environment.
Good points, and I hope that the real workshops will have a more polished & cohesive presentation of the scripts. I'm guessing that the real workshops won't cover the code as much as yesterday. The plan is to run much more behind the scenes (and most even before the conference) so that participants don't have to be aware of the code between the PCS and the transcriber code (which follows "II" --the first connection between the server and their laptop).
Ideally the PCS is completed several weeks before the conference (which means everything until the transcriber is run on our server, instead of their laptops). We asked you guys to complete the PCS the morning of, so we could better gauge its usability. I'm glad we did, because you guys gave helpful suggestions that we hadn't anticipated (like presenting fewer survey pages to facilitate ctrl+F searching).
Perhaps a drop down menu where the user could select the variables they have in their data, and then only respond to questions on these variables would be simpler (if possible)? Alternatively, including all the cognitive variables on the same page as discussed could allow the user to search (cntr. F) for their variables. Or, based on the study they select on page 1, perhaps only variables we know are available to them would appear?
It's funny, we built this initially, but thought it was overwhelming. So we broke it into pages (which in hindsight was a mistake) and removed the initial checkboxes (which probably wasn't a mistake).
The checkboxes enabled something like your suggestion "and then only respond to questions on these variables". Based on the checkboxes, textboxes were shown for only their variables. (In a small mock-up, @Maleeha produced this effect with item-specific branching logic). However in the end, we felt the checkboxes unnecessarily doubled the amount of items, and increased the chances of incorrect/inconsistent responses. The user still had to go through each variable (and the checkbox stage), and then had to to the textboxes for all the checked variables.
As we might have mentioned yesterday, we'd like to pre-populate their PCS responses when they return to subsequent workshops. That's one reason @GracielaMuniz, @ampiccinin, @Maleeha, and others spent so much time enumerating & categorizing the possible IALSA-ish variables. The most consistent we get the list, the more likely we'll be able to reuse (and pre-populate) those sections in future PCSes.
If you have other ideas likes checkboxes, please tell @andkov in person, or share them here. We're very invested in making this as ergonomical as possible. For the sake of sharing scientific ideas, we want participants to focus more on concepts and not the interface. (Yikes, can you tell I've spent a solid week with @andov?) Pragmatically, they'll be more eager/likely to come back an participate.
Providing future users with a guideline (like what was written on the bored) would be useful.
That would be nice, and we should definitely do that. I'm almost afraid to ask @andkov what diagram he's designing to assist the participant along the future workshop's journey and dawn of discovery.
wibeasley
commented
8 years ago @bpmulligan:
Particularly, it was complicated by the fact that I was running a very minimized OS that did not have a lot of basic software packages that would be found on a typical install of Linux. Although I could run R and RStudio without issue, my system was not equipped to run the packages required by the "stencil" scripts. I like Will's suggestion of creating a system-check/package installation script for folks to run before arriving at the workshop.
Yeah, I'm glad you brought this use case to our attention. Last year, I believe IALSA supplied laptops to everyone. If this isn't the case in the future, we definitely should be more explicit about what software needs to be installed & operational on their laptop before they leave their school and get on the plane.
Regarding that specific case, everything works on my Linux laptop, but I've been running these programs for months on it, and the cost of misbehaving packages has been amortized. We need to prevent them coming to the workshop with a fresh & untested laptop, regardless of the OS. Also, I think requiring an operational Mplus installation will filter out some of these cases.
I wanted to address/regurgitate two more great suggestions of yours. Please correct my paraphrases if they're too far off.
Participant could remote into a centralized server provided by UVic/IALSA.
That's something we never considered. You're right --providing a virtualized desktops (on a server that UVic/IALSA manages) could drastically reduce the variability of people's setup. As @andkov pointed out, some investigators would be allowed to put their PHI on another school's server. But for the other investigators (especially those using publicly available data), life would be a lot easier. It would also be cheaper for them if they don't have an Mplus license already on their laptop.
UVic/IALSA could maintain the VM in between workshops, but keep it turned off most of the time (to save costs). Similarly, this could be hosted on Amazon EC2 server. As I showed after the workshop officially ended, I've had a lot of success with this EC2 arrangement in other situations. (Note to self, an Amazon Workspace VDI would be unnecessarily expensive if each desktop needed an Mplus license that license was used only ~2 workshops a year.)
We'd need to:
Allow participants to "set the sensitivity/specificity dial" on their model diagnostics.
This is such a good idea that we weren't even close to. We have some reports model diagnostics (and some more planned), but we never considered that different studies should have customizable settings, based on their (a) quality, (b) size, and (c) familiarity.
As we build these mechanisms, we'll ask you for more thoughts on which dials are worthwhile.
wibeasley
commented
8 years ago @raquelgraham
I am a very visual learner, so I especially liked the features of the ReadMe document and the road map of the process that was drawn on the whiteboard.
Good, in addition to the static diagram, we hope to have a live diagram that shows the workshop's percent progress through each stage (eg, 96% into "I"; 93% into "II", ...). Tell us if you have other thoughts how to make the diagram more salient to the experience.
I wasn't very familiar with this type of modeling or the software before, so I appreciated how Andrey took the time to introduce the overall objectives and model building steps prior to jumping into everything.
...Something similar to the road map you had drawn on the board, but with more details at each step....
@andkov will follow up with you on which aspects you thought were most important. We want to better balance between (a) providing enough implementation details so they're comfortable, yet (b) not distracting them from the forest (ie the aging research questions).
It may be helpful to create some sort of resource for drivers to review prior to actually using the software.
Even if they didn't need the pre-req knowledge (which they do), seeing this material ahead of time may make them more comfortable when entering the workshop.
Perhaps this could be in the form of a pdf with some screenshots of you working through an example data set, or even a short youtube video explaining the process.
Are you volunteering to be the hand model on the YouTube examples involving laptops?
When filling out the pre-conference survey I had a few questions come up, such as what to do if a certain variable wasn't available in our dataset. It would be helpful to have some more explicit instructions in the survey (e.g., leave it blank vs. writing "n/a", etc.).
You're right, and I'm glad you guys illuminated this yesterday. The PCS needs to more clearly communicate the consequences of a study lacking certain (quality) variables. In my mind the categorizes are:
implementing a checklist for drivers to complete about their data prior to using this software.
I think this would couple nicely with the "dataset validator" we've sketched out. This is the software that checks the consistency between a participant's PCS responses and their dataset (eg, making sure the variables are spelled correctly, so the Mplus syntax will work).
In addition to running the "dataset validator", they could run this check list that makes sure that the correct packages are installed. It could build on top of the existing install-packages.R. MplusAutomation should be added too. Anything else besides GitHub that you can think of?
Thank you again everyone, including @Maleeha and @casslbrown. Again, this document is in the repo as a single document.
@beccav8, @raquelgraham , @bpmulligan, please answer the following questions to help us improve the software use for coordinted analysis.