Open aaust opened 3 years ago
Alex,
I think you are correct in looking at the FCAL component of the trigger for the source of these excess low-momentum tracks. Can you see if the excess small-angle tracks below the beam hole come in the same events with the ones in the first quadrant? I am suspecting e+e- pairs, where both local peaks are brought in by a trigger acceptance in one of the two regions. A test of this would be to look for a correlation between tracks matching in the first quadrant where the trigger selects them (not there in MC sample or in the random events) and tracks that match to the accumulation below the beam hole.
-Richard J.
On Tue, Sep 14, 2021 at 11:31 AM Alex Austregesilo @.***> wrote:
Comparing the monitoring plots for a recent bggen sample with the real data reconstruction, I noticed a striking difference in the track matching rate for small radii around the beam hole.
For real data (e.g. 2017), we see an accumulation of tracks matched to showers for R<20cm (bottom row, right plot). The extra showers are mostly located in the 1st quadrant, which corresponds to the region where some of the inner FCal blocks were not masked in the trigger (bottom row, left plot), but there is a second cluster below the hole. [image: recon_ver03] https://camo.githubusercontent.com/a32573981c6460e69f6b5c6da1212dd9f5896b6d26f655aa0c86e9fae6455d38/68747470733a2f2f68616c6c647765622e6a6c61622e6f72672f776f726b2f68616c6c64322f646174615f6d6f6e69746f72696e672f52756e506572696f642d323031372d30312f7265636f6e5f76657230332f52756e3033303733302f486973744d6163726f5f4d61746368696e675f4643414c2e706e67
In the MC sample, this is effect is not simulated. Could there be a background component that is beam-correlated, which is not taken into account properly by the random trigger background?
— You are receiving this because you are subscribed to this thread. Reply to this email directly, view it on GitHub https://github.com/JeffersonLab/HDGeant4/issues/196, or unsubscribe https://github.com/notifications/unsubscribe-auth/AB3YKWC2VITTA5EJ27PCOYTUB5TGVANCNFSM5EANZA7A . Triage notifications on the go with GitHub Mobile for iOS https://apps.apple.com/app/apple-store/id1477376905?ct=notification-email&mt=8&pt=524675 or Android https://play.google.com/store/apps/details?id=com.github.android&referrer=utm_campaign%3Dnotification-email%26utm_medium%3Demail%26utm_source%3Dgithub.
The trigger simulation seems to have the correct mask with the hole in the first quadrant: I assume there is just no EM background to trigger any events. I will try the BeamPhotons background or directly some BH signal.
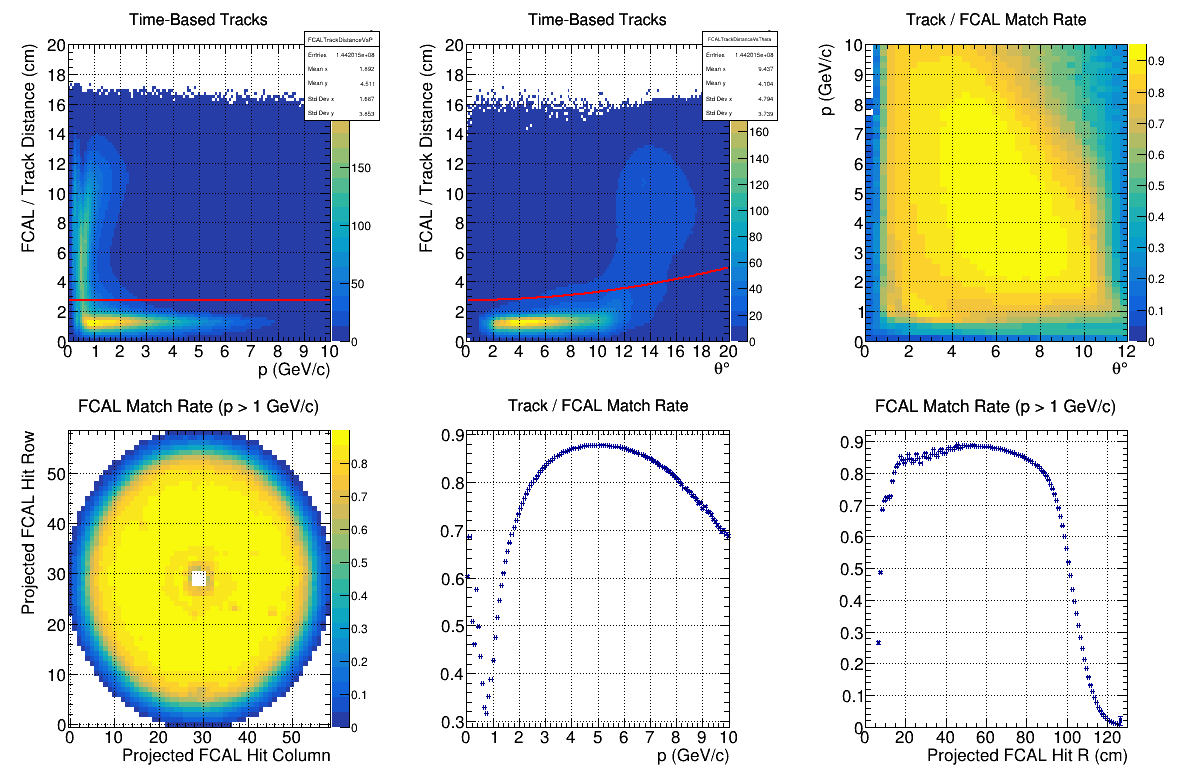
When the trigger mask was fixed in 2018, the peak in the match rate for real data disappeared:
For the 2017 data set, the first 3 rings are not calibrated (R < 20 cm), this is clearly seen on slide 8 of https://halldweb.jlab.org/primexd/gluex-201701/gluex_201701_method0_period_0.pdf. The pi0 peak position and width are off and much larger, respectively. Furthermore if in standard analysis, there is a fiducial cut that excludes the first 3 inner rings and the last three outer rings for photons, it must also be applied for tracks.
Related to the behavior below 1 GeV.
The current MC simulation FCAL non-linear energy correction corresponds to this https://logbooks.jlab.org/entry/3810677 but the parametrization below 1GeV is wrong as reported in https://halldweb.jlab.org/wiki-private/images/7/7c/Glue-primexd-igal-jaegle-28052020.pdf slide-6.
Thinking a little bit more about the modeling of beam backgrounds in the FCAL, I selected the first couple inner rings and looked at a few distributions in the random and PS triggers, which should just be due to backgrounds.
For reference, here's the energy distribution for the FCAL hits:
But one main thing to look at is the distribution of hit times:
and hit time - RF time:
Note that in these events, we don't have enough information to pick out the "correct" beam bunch, but we at least see that there is a some structure correlated with the beam timing, and nothing else besides that - basically what one would expect from the random trigger.
We can look at the PS triggered events:
FCAL hit time:
FCAL hit time - RF time:
And there is a peaking structure - this is maybe correlated to the PS event?
Sean,
Interesting! These could be pair conversion with final-state radiation from one of the leptons, but before we look into that, can you see if this signal survives simple cuts to select tagged events that pass an energy conservation cut with the tagger? We know from studies without the converter that a significant fraction of the PS triggers come from showering of beam photons in material in / just after the PS, and have no energy correlation with the tagger. This is what Sasha showed some weeks back. Those could be as much as 10% of the PS triggers with the 75 micron converter, which is probably higher than the fraction of radiative pair events in the converter. This is a pretty big signal, so I am guessing it is a beam background of some kind that lights up both the PS and the FCAL.
On the other hand, if it is really a radiative QED process in the converter, I can simulate that with an absolute cross section normalization using the internal QED generator in hdgeant4, and use it as a new way to check the systematics of our flux. This would play the same role as Compton scattering in PRIMEX, except that it would include the converter target thickness instead of the LiqH2 target, whose ratio is another systematic in our normalization.
-Richard Jones
On Wed, Dec 15, 2021 at 12:57 PM Sean Dobbs @.***> wrote:
Thinking a little bit more about the modeling of beam backgrounds in the FCAL, I selected the first couple inner rings and looked at a few distributions in the random and PS triggers, which should just be due to backgrounds.
For reference, here's the energy distribution for the FCAL hits: [image: fcal_random_energy] https://user-images.githubusercontent.com/1182058/146238477-919b2a96-9170-4005-96ea-a897d63ec0c7.png
But one main thing to look at is the distribution of hit times: [image: fcal_random_time] https://user-images.githubusercontent.com/1182058/146238479-b28001ea-121b-4788-9522-eb12a0748fea.png
and hit time - RF time: [image: fcal_random_rf_time] https://user-images.githubusercontent.com/1182058/146238478-4403fb37-61fe-4c37-b3cf-219458824d30.png
Note that in these events, we don't have enough information to pick out the "correct" beam bunch, but we at least see that there is a some structure correlated with the beam timing, and nothing else besides that - basically what one would expect from the random trigger.
We can look at the PS triggered events:
FCAL hit time: [image: fcal_ps_time] https://user-images.githubusercontent.com/1182058/146238475-4a65e46c-0a6c-40aa-af2b-6434d95c3cdc.png
FCAL hit time - RF time: [image: fcal_ps_rf_time] https://user-images.githubusercontent.com/1182058/146238472-8c3238dd-f312-4255-98a2-6c54bc0221db.png
And there is a peaking structure - this is maybe correlated to the PS event?
— You are receiving this because you commented. Reply to this email directly, view it on GitHub https://github.com/JeffersonLab/HDGeant4/issues/196#issuecomment-995029963, or unsubscribe https://github.com/notifications/unsubscribe-auth/AB3YKWHMZO7EIUUFMFIXWTDURDJILANCNFSM5EANZA7A . Triage notifications on the go with GitHub Mobile for iOS https://apps.apple.com/app/apple-store/id1477376905?ct=notification-email&mt=8&pt=524675 or Android https://play.google.com/store/apps/details?id=com.github.android&referrer=utm_campaign%3Dnotification-email%26utm_medium%3Demail%26utm_source%3Dgithub.
The e+e- pair from a legitimate PS trigger is depositing multi-GeVs into the Hall. Are we sure that the shielding behind the PS detectors will absorb all of that energy? If not you would expect a prompt peak in the FCAL and elsewhere as well.
Richard, Mark - interesting point. Here are timing plots where I've rejected events that have a PS coincidence within 0.5 GeV of a tagger hit, and the peak does go away. I don't quite understand the timing, though - there's about a 20 ns difference between this peak and the prompt PS time peak, which corresponds to about 6 m. I think there's a larger difference between the PS and FCAL than this...
FCAL hit time (reject PS/tagger coincidences):
FCAL hit time - RF time (reject PS/tagger coincidences):
Sean, can you show the two plots you are referring to, that show this 20ns shift in the peak position between them? -Richard J.
On Wed, Dec 15, 2021 at 5:03 PM Sean Dobbs @.***> wrote:
Richard, Mark - interesting point. Here are timing plots where I've rejected events that have a PS coincidence within 0.5 GeV of a tagger hit, and the peak does go away. I don't quite understand the timing, though - there's about a 20 ns difference between this peak and the prompt PS time peak, which corresponds to about 6 m. I think there's a larger difference between the PS and FCAL than this...
FCAL hit time (reject PS/tagger coincidences):
[image: fcal_ps_time-cut] https://user-images.githubusercontent.com/1182058/146271856-db91a02a-1cba-4ac4-86cb-16ce5b60ca6a.png
FCAL hit time - RF time (reject PS/tagger coincidences):
[image: fcal_ps_rf_time-cut] https://user-images.githubusercontent.com/1182058/146271875-97a0342c-6622-472c-af33-d693b0859e78.png
— You are receiving this because you commented. Reply to this email directly, view it on GitHub https://github.com/JeffersonLab/HDGeant4/issues/196#issuecomment-995248625, or unsubscribe https://github.com/notifications/unsubscribe-auth/AB3YKWB5DYWFRSH4ARPSPB3UREGBTANCNFSM5EANZA7A . Triage notifications on the go with GitHub Mobile for iOS https://apps.apple.com/app/apple-store/id1477376905?ct=notification-email&mt=8&pt=524675 or Android https://play.google.com/store/apps/details?id=com.github.android&referrer=utm_campaign%3Dnotification-email%26utm_medium%3Demail%26utm_source%3Dgithub.
Sure, here is a zoomed in version of the above timing peak in the FCAL for PS triggered events, and also attached is the PS timing peak. The FCAL times peak at about -8 ns, while the PS times peak at about -28 ns (very roughly).
I think this should be a consistent comparison, since the PS timing is aligned to the tagger, which is aligned to the main spectrometer, but maybe there are some offsets I don't quite understand.
In doing the timing calibration of the PS, they would all be aligned relative to the tagger to put the PS peak at zero, AFAIK. In that case, t=0 in the PS clock would be the time when the converted photon would be passing through the region parallel to the PS coarse counters so that they fire at the same time as the beam photon would have passed, had it not converted in the converter.
In doing the timing calibration of the FCAL, the block offsets would all be aligned relative to the tagger to put the peaks where they should be if t=0 marked the instant when the interacting beam photon (would have) crossed through the center of the target at z=65. AFAIK, this is the unified clock reference that is used for all timing calibrations in the GlueX detector, isn't it?
In this case, the FCAL times should be 6m / c later than the PS times if they are in the same events, because the FCAL is 6m downstream of the z=65 time reference of the FCal time calibration. That is about 20ns, right?
-Richard
On Wed, Dec 15, 2021 at 5:27 PM Sean Dobbs @.***> wrote:
Sure, here is a zoomed in version of the above timing peak in the FCAL for PS triggered events, and also attached is the PS timing peak.
I think this should be a consistent comparison, since the PS timing is aligned to the tagger, which is aligned to the main spectrometer, but maybe there are some offsets I don't quite understand.
[image: fcal_t_peak] https://user-images.githubusercontent.com/1182058/146274215-1775a9ab-3734-40f7-9418-9ad9381aea60.png [image: ps_t_peak] https://user-images.githubusercontent.com/1182058/146274214-6b9198de-e1aa-41d9-a297-5ffe58db77d7.png
— You are receiving this because you commented. Reply to this email directly, view it on GitHub https://github.com/JeffersonLab/HDGeant4/issues/196#issuecomment-995262997, or unsubscribe https://github.com/notifications/unsubscribe-auth/AB3YKWD4QYUQ5TWOUUMTMXTUREI4RANCNFSM5EANZA7A . Triage notifications on the go with GitHub Mobile for iOS https://apps.apple.com/app/apple-store/id1477376905?ct=notification-email&mt=8&pt=524675 or Android https://play.google.com/store/apps/details?id=com.github.android&referrer=utm_campaign%3Dnotification-email%26utm_medium%3Demail%26utm_source%3Dgithub.
Sean, if I understand correctly what you did, you have demonstrated a 4-way coincidence: tagger + PSleft + PSright + FCAL, that is, a radiative pair production reaction with a very measurable rate and a clear signature. Do you agree with this interpretation?
Besides serving as a tool for checking our flux systematics, this has another interesting use: a tagged "beam" of photons with a well-known energy going into the inner blocks of the FCAL that we can use for calibration of the inner rings of the FCAL, and tuning of the simulation response in this poorly understood region. The PS + tagger can tell us this photon energy with ~50MeV accuracy, better than any other photon source we have based on reconstructed neutral meson decays.
-Richard Jones
On Wed, Dec 15, 2021 at 5:52 PM Richard Jones @.***> wrote:
In doing the timing calibration of the PS, they would all be aligned relative to the tagger to put the PS peak at zero, AFAIK. In that case, t=0 in the PS clock would be the time when the converted photon would be passing through the region parallel to the PS coarse counters so that they fire at the same time as the beam photon would have passed, had it not converted in the converter.
In doing the timing calibration of the FCAL, the block offsets would all be aligned relative to the tagger to put the peaks where they should be if t=0 marked the instant when the interacting beam photon (would have) crossed through the center of the target at z=65. AFAIK, this is the unified clock reference that is used for all timing calibrations in the GlueX detector, isn't it?
In this case, the FCAL times should be 6m / c later than the PS times if they are in the same events, because the FCAL is 6m downstream of the z=65 time reference of the FCal time calibration. That is about 20ns, right?
-Richard
On Wed, Dec 15, 2021 at 5:27 PM Sean Dobbs @.***> wrote:
Sure, here is a zoomed in version of the above timing peak in the FCAL for PS triggered events, and also attached is the PS timing peak.
I think this should be a consistent comparison, since the PS timing is aligned to the tagger, which is aligned to the main spectrometer, but maybe there are some offsets I don't quite understand.
[image: fcal_t_peak] https://user-images.githubusercontent.com/1182058/146274215-1775a9ab-3734-40f7-9418-9ad9381aea60.png [image: ps_t_peak] https://user-images.githubusercontent.com/1182058/146274214-6b9198de-e1aa-41d9-a297-5ffe58db77d7.png
— You are receiving this because you commented. Reply to this email directly, view it on GitHub https://github.com/JeffersonLab/HDGeant4/issues/196#issuecomment-995262997, or unsubscribe https://github.com/notifications/unsubscribe-auth/AB3YKWD4QYUQ5TWOUUMTMXTUREI4RANCNFSM5EANZA7A . Triage notifications on the go with GitHub Mobile for iOS https://apps.apple.com/app/apple-store/id1477376905?ct=notification-email&mt=8&pt=524675 or Android https://play.google.com/store/apps/details?id=com.github.android&referrer=utm_campaign%3Dnotification-email%26utm_medium%3Demail%26utm_source%3Dgithub.
Richard, that is certainly possible, though we would probably want to do some more studies (and perhaps simulations?) to be convinced that this signal is really due to radiative photons and not some splash of energy from some other interaction upstream of the FCAL (there is a lot of upstream). It's a very cool possibility.
Regarding the timing, I think you're right - the tagger counters are aligned to have t=0 at z=65, so the PS should be this way as well since the PS is aligned against the tagger.
Comparing the monitoring plots for a recent bggen sample with the real data reconstruction, I noticed a striking difference in the track matching rate for small radii around the beam hole.
For real data (e.g. 2017), we see an accumulation of tracks matched to showers for R<20cm (bottom row, right plot). The extra showers are mostly located in the 1st quadrant, which corresponds to the region where some of the inner FCal blocks were not masked in the trigger (bottom row, left plot), but there is a second cluster below the hole.
In the MC sample, this is effect is not simulated. Could there be a background component that is beam-correlated, which is not taken into account properly by the random trigger background?