JesperLekland / react-native-svg-charts

📈 One library to rule all charts for React Native 📊
MIT License
2.36k stars 410 forks source link

Y-axis labels incorrectly updated when data changes. #305

Open bmwertman opened 5 years ago

bmwertman commented 5 years ago

What is the problem?

I have an array of objects with 3 properties on each; time, salinity and volume.

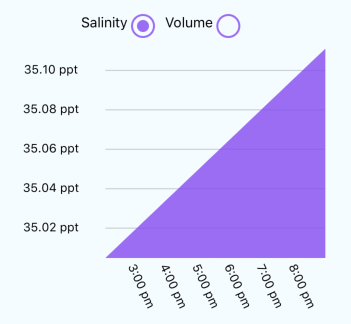
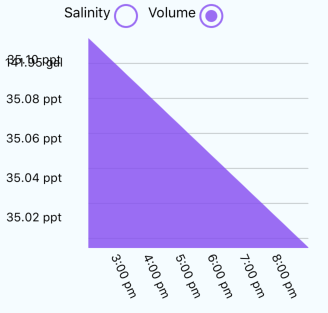
When I switch from rendering time and salinity to rendering time and volume, or vice versa, the labels on the Y-axis do not change as expected. The new Y-axis labels get bunched up together on top of each other. The old Y-axis labels from the initial render remain on the chart

Charted data and X-axis(time) change as expected.

This sounds very similar to this issue, Labels not re-rendering correctly when data changes #135

When does it happen?

Toggle the component's dataView state, which is used in both the yAccessor and formatLabel functions, from 'salinity' to 'volume' or from 'volume' to 'salinity'

What platform?

Versions

React Native version: 0.58.6 react-native-svg: 9.3.3 react-native-svg-charts-version: 5.2.0 and JesperLekland/react-native-svg-charts#c9f5c39c35230c75dcd040f2ace80b6362a80470

Code to reproduce

import React from 'react'
import { AreaChart, Grid, XAxis, YAxis } from 'react-native-svg-charts'
import * as shape from 'd3-shape'
import moment from 'moment'

let width = Dimensions.get('window').width

export default class AtoChart extends React.PureComponent {
  constructor (props) {
    super(props)
    this.state = {
      dataView: 'salinity',
      data: [
             {
               salinity: 35.00
               time: Tue Mar 19 2019 15:00:41 GMT-0400 (EDT)
               volume: 141.99
             },{
               salinity: 35.03
               time: Tue Mar 19 2019 16:00:41 GMT-0400 (EDT)
               volume: 141.93
             },{
               salinity: 35.047
               time: Tue Mar 19 2019 17:00:41 GMT-0400 (EDT)
               volume: 141.87
             },{
               salinity: 35.07
               time: Tue Mar 19 2019 18:00:41 GMT-0400 (EDT)
               volume: 141.81
             },{
               salinity: 35.09
               time: Tue Mar 19 2019 19:00:41 GMT-0400 (EDT)
               volume: 141.75
             },{
               salinity: 35.11
               time: Tue Mar 19 2019 20:00:41 GMT-0400 (EDT)
               volume: 141.69
             }]
    }
    this.selectDisplayData = this.selectDisplayData.bind(this)
  }

  selectDisplayData (btn) {
    this.setState({ dataView: btn.toLowerCase() })
  }

  render () {
    return (
      <View style={{ height: 300, marginTop: 20, marginHorizontal: ((65 - width) * -1 ) / 2, height: 260 }}>
        <RadioBtns
          selected={this.state.dataView }
          selectItem={this.selectDisplayData}
          btns={['Salinity', 'Volume']} // Capitalized for label but needs to match data property name after .toLowerCase()
          color={'rgba(134, 65, 244, 0.8)'} />
        <View style={{ display: 'flex', flexDirection: 'row'}}>
          <YAxis
            numberOfTicks={5}
            data={this.state.data}
            formatLabel={value => this.state.dataView === 'volume' ? `${(value).toFixed(2)} gal ` : `${(value).toFixed(2)} ppt `}
            yAccessor={({ item }) => item[this.state.dataView]}
            style={{marginRight: 5, height: 210, width: (width - 60) * 0.3}}
          />
          <View>
            <AreaChart
              numberOfTicks={5}
              style={{ height: 210, width: (width - 60) * 0.7  }}
              yAccessor={({ item }) => item[this.state.dataView]}
              data={this.state.data}
              svg={{ fill: 'rgba(134, 65, 244, 0.8)' }}
            >
              <Grid numberOfTicks={5} />
            </AreaChart>
            <XAxis
              data={this.state.data}
              style={{ height: 55, width: (width - 60) * 0.7 }}
              contentInset={{ right: 60 }}
              xAccessor={({ item }) => item.time}
              formatLabel={value => moment(value).format('h:mm a')}
              svg={{ rotation: 65, originY: 45 }}
            />
          </View>
        </View>
      </View>
    )
  }
}
import React from 'react'
import { View, Text, TouchableHighlight } from 'react-native'
const RadioBtns = (props) => (
  <View style={{ justifyContent: 'center', display: 'flex', flexDirection: 'row' }}>
    {props.btns.map((btn, key) =>
      <View key={key} style={{ display: 'flex', flexDirection: 'row', marginBottom: 10 }}>
        <Text style={{ marginRight: 3 }}>{btn}</Text>
        <TouchableHighlight onPress={() => props.selectItem(btn)}>
          <View
            style={[{
              height: 24,
              width: 24,
              borderRadius: 12,
              borderWidth: 2,
              marginRight: 10,
              borderColor: props.color,
              alignItems: 'center',
              justifyContent: 'center'
            }, props.style]}>
            {
              props.selected === btn.toLowerCase()
                ? <View
                  style={{
                    height: 12,
                    width: 12,
                    borderRadius: 6,
                    backgroundColor: props.color }} />
                : null
            }
          </View>
        </TouchableHighlight>
      </View>
    )}
  </View>
)
export default RadioBtns

Screenshots

Initial Render Screen Shot 2019-03-19 at 3 43 17 PM

Rerender after dataView state's value is changed Screen Shot 2019-03-19 at 3 45 47 PM

caglardurmus commented 3 years ago

Hi, i had the same issue too. OnChangeDate first setDate with empty array ([]) then set your data with time out. It fixed my problem.

 const onSwitchChange = (index) => {
        setData([]);
        setTimeout(() => {
            setData([50, 10, 40, 95, 85, 95, 35, 53, 24, 50])
        }, 100)

    }