JesperLekland / react-native-svg-charts

📈 One library to rule all charts for React Native 📊
MIT License
2.35k stars 407 forks source link

Doesn't display line on chart with null or undefined data #399

Open DhavalKakadiya opened 4 years ago

DhavalKakadiya commented 4 years ago

What is the problem?

There are not display lines when data has a null or undefined value. can you please give me a solution for that?

React Native version: 0.61.1 react-native-svg-charts-version: ^5.3.0

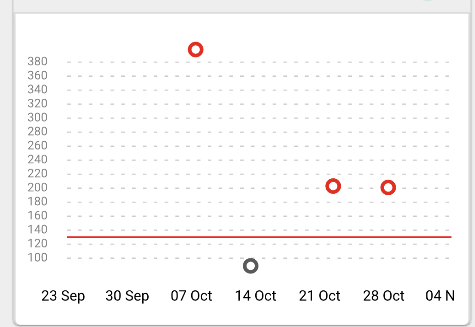
line chart data is like below, data = [null, null, null, null, null, null, null, null, null, null, null, null, null, null, 398, null, null, null, null, null, 89, null ]

There are display just chart points, but not lines. A chart is a display like this, Screenshot 2019-11-04 at 4 36 28 PM

usrbowe commented 4 years ago

@DhavalKakadiya if I'm not mistaken, the line chart needs at least two consecutive points to draw the line.

But for your solution, I would just map null to 0, so line can be drawn:

data = [null, null, null, null, null, null, null, null, null, null, null, null, null, null, 398, null, null, null, null, null, 89, null ].map(value => !value ? 0 : value);

This will also draw the circle on 0 values, so you can filter that out like this:

const Decorator = ({ x, y, data }) => {
      return data.map((value, index) => {
        if (value === 0) return null;
        return (
          <Circle
            key={index}
            cx={x(index)}
            cy={y(value)}
            r={4}
            stroke={'rgb(134, 65, 244)'}
            fill={'white'}
          />
        );
      });
    };

Here is Snack Demo: https://snack.expo.io/@usrbowe2/13a818

DhavalKakadiya commented 4 years ago

Yes Thanks, @usrbowe, But if I used 0 then chart UI does not look which I want. because when I used 0 the line touch on bottom bar XAxis, and I don't want to touch it on the bottom. I want that chart line connected to the point of value of greater than 0 or not null.

usrbowe commented 4 years ago

@DhavalKakadiya I see. So you want something like this? image

DhavalKakadiya commented 4 years ago

@usrbowe , Yes but start line from origin.

usrbowe commented 4 years ago

@DhavalKakadiya alright, I think I got it: image

To render <LineChart /> like this, we need to remove .defined((item) => typeof item.y === 'number') from: https://github.com/JesperLekland/react-native-svg-charts/blob/dev/src/line-chart/line-chart.js#L12

DhavalKakadiya commented 4 years ago

@usrbowe, but your chart point is not connected to each other which I provided.

usrbowe commented 4 years ago

@DhavalKakadiya I'm not sure actually what is your desired output. Can you draw how you want the chart to look like? Thanks

DhavalKakadiya commented 4 years ago

@usrbowe , I want to chart like this. Ignore tooltip UI. I have just display data looks like below image. Screenshot 2019-11-12 at 5 04 05 PM

usrbowe commented 4 years ago

@DhavalKakadiya Alright, I think I got it here:

Basically it uses time series, so it doesn't really on number of data values, but rather on time scale.

image
const data = [
  {
    value: 0,
    date: new Date('2019-10-01'),
  },
  {
    value: 400,
    date: new Date('2019-10-05'),
  },
  {
    value: 80,
    date: new Date('2019-10-12'),
  },
  {
    value: 200,
    date: new Date('2019-10-22'),
  },
  {
    value: 201,
    date: new Date('2019-10-28'),
  },
  {
    value: 250,
    date: new Date('2019-11-08'),
  },
  {
    value: 20,
    date: new Date('2019-11-13'),
  },
];

const Decorator = ({x, y, data}) => {
  return data.map((value, index) => (
    <Circle
      key={index}
      cx={x(value.date)}
      cy={y(value.value)}
      r={4}
      stroke={'rgb(134, 65, 244)'}
      fill={'white'}
    />
  ));
};

<LineChart
  style={{flex: 1}}
  data={data}
  yAccessor={({item}) => item.value}
  xAccessor={({item}) => item.date}
  svg={{stroke: 'rgb(134, 65, 244)'}}
  contentInset={{top: 10, bottom: 10}}>
  <Decorator />
  <Grid />
</LineChart>
<XAxis
  data={data}
  svg={{
    fill: 'black',
    fontSize: 8,
    fontWeight: 'bold',
    rotation: 20,
    originY: 30,
    y: 5,
  }}
  xAccessor={({item}) => item.date}
  scale={scale.scaleTime}
  // numberOfTicks={6}
  style={{marginHorizontal: -15, height: 20}}
  contentInset={{left: 10, right: 25}}
  formatLabel={value => format(value, 'dd MMM')}
/>
DhavalKakadiya commented 4 years ago

@usrbowe, Thank for the reply. I know that we can display it from the above code. But my question is that I want to display a chart when if any value is null from the data array. For example, in the above data array suppose date '2019-10-22' has no data. So, we set a value null value for that index and then look at how to draw a chart. It will not display the same as the above image. I want to draw a chart if the date '2019-10-22' value as null then not need any chart point that index but it would directly connect their next index value point.

usrbowe commented 4 years ago

@DhavalKakadiya I'm not sure I understand. There is nothing be drawn if value for date is null, but with time series chart, it will keep the empty dates. So we just need to filter out null values first.

DhavalKakadiya commented 4 years ago

@usrbowe, No I need that all values. I have to need to display the last 6 week data. So, if any data of null in between dates then it's skipping that and connect next date points. Thanks for the help !! Now, I am using another library for that.

component6 commented 4 years ago

@usrbowe, No I need that all values. I have to need to display the last 6 week data. So, if any data of null in between dates then it's skipping that and connect next date points. Thanks for the help !! Now, I am using another library for that.

Good day. I faced the same problem. Please tell me how you solved your problem.

abustamam commented 4 years ago

@DhavalKakadiya @component6 don't know if you folks got your answer, but I found a way to do this by using 0 instead of null. Then you'll create a new function that does something like this:

// this generates the SVG for feeding into Path or Circle
const generateLine = ({ data, x, y }) => {
  const points = data.reduce((acc, { value }, idx) => {
    if (!value) {
      return acc;
    }
    // use the d3 functions to get the SVG coords
    const xVal = x(idx);
    const yVal = y(value);
    return [...acc, { xVal, yVal }];
  }, []);

  // generates a path, essentially the "line" that connects each "node"
  const path =
    points.length === 1
      ? ''
      : `M${points.map(({ xVal, yVal }) => `${xVal},${yVal}`).join('L')}`;

  return [
    {
      path,
      points,
    },
  ];
};

Use this function like this:

const L = ({ stroke, ...props }) => {
  const pts = generateLine(props);

  return (
    <G>
      {pts.map(({ path, points }) => (
        // note: may not be best practice, but IMO better than using index
        <G key={`g--${path}`}>
          <Path d={path} fill="none" stroke={stroke} strokeWidth={2} />
          {points.map(({ xVal, yVal }) => (
            <Circle
              key={`circle--${xVal}-${yVal}`}
              r={3}
              cx={xVal}
              cy={yVal}
              stroke="none"
              fill={stroke}
            />
          ))}
        </G>
      ))}
    </G>
  );
};

Then render the line chart:

<LineChart data={data}>
  <L stroke="red" />
</LineChart>

Hope that works!

jcoulaud commented 4 years ago

@DhavalKakadiya @component6 don't know if you folks got your answer, but I found a way to do this by using 0 instead of null. Then you'll create a new function that does something like this: ...

Thx for this solution! I tried it but without any luck. I have this Error: Unexpected: M

abustamam commented 4 years ago

@jcoulaud that's odd. It looks like it's trying to parse your path for some reason. Do you have a Snack that you can share?

jcoulaud commented 4 years ago

Here it is: https://snack.expo.io/@jcoulaud/line-charts-gaps But on the snack, apparently, there is no error, only a blank chart :/

abustamam commented 4 years ago

@jcoulaud what version of RNSVG/RNSVG charts are you using?

I got a different behavior on iOS android and web when i tried your snack:

2020-05-08_12-36-04

https://github.com/react-native-community/react-native-svg/issues/1084

See if updating RNSVG helps.

jcoulaud commented 4 years ago

The one installed with expo install react-native-svg > 11.0.1

chika-kasymov commented 3 years ago

If somebody will need it, in my case, I patched the package to filter out missing ys:

        // In the chart.js
        const mappedData = data.map((item, index) => ({
            y: yAccessor({ item, index }),
            x: xAccessor({ item, index }),
        })).filter(item => item.y !== undefined && item.y !== null) // <-- here is the filtering logic

This works for the linear chart. Not sure if this fix breaks other chart types.

SofiaMiMIAT commented 1 month ago

Hi, I am experiencing the same issue. I want to display all the labels, and if the value is null or 0, not show the point. Did anyone manage to solve this?