LRydin / MFDFA

Multifractal Detrended Fluctuation Analysis in Python
MIT License
125 stars 27 forks source link

Design a singularity spectrum code #2

Open LRydin opened 4 years ago

LRydin commented 4 years ago

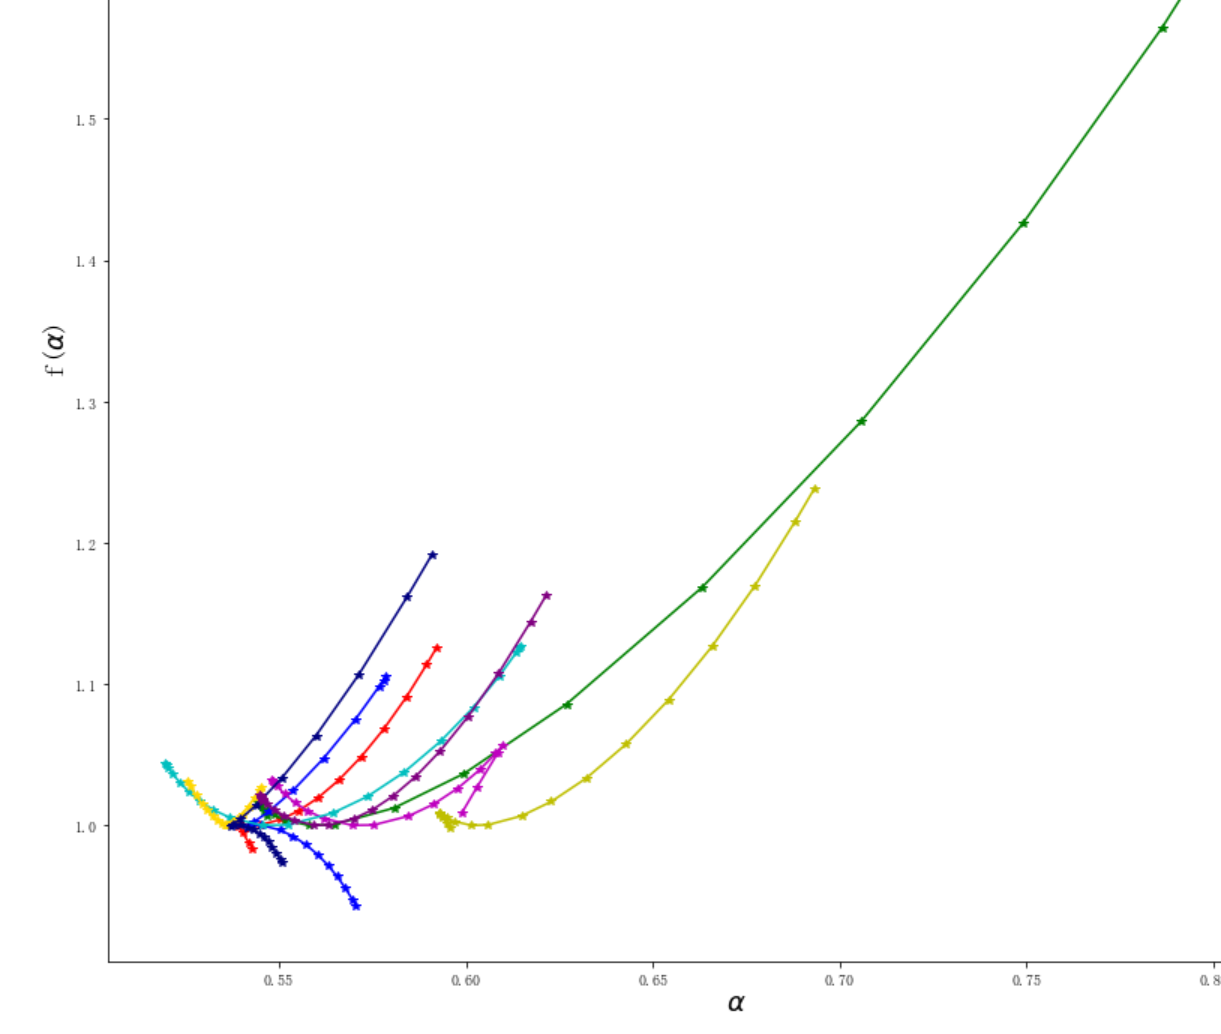
Include a Singularity spectrum code to understand the strength of the multifractality of the timeseries:

Screenshot from 2020-07-03 17-57-57

This is found in: Multifractal detrended fluctuation analysis of nonstationary time series, or for example on the Matlab code and paper: Introduction to multifractal detrended fluctuation analysis in Matlab

LRydin commented 1 year ago

Hey @mikemelon that is indeed strange. You are absolutely correct in your observation. H(q) should be a constant or decreasing function of q, mathematically. But it is not so unusual that in real-world data this is not the case. Could you show me how you define q and how you get these plots out?

Cheers!

mikemelon commented 1 year ago

@LRydin Thank you. you are too quick, I define q in np.linspace(-5,5, 11), however, the adjustion of q is not bother, the modification of length of data limits does! Here is some of my code, I divided MFDFA in two steps, and plot H(q)-q and $f(\alpha)-\alpha$ in an iteration. btw, I have got even confused results, see picture below. my code my pic2

LRydin commented 1 year ago

Hey @mikemelon, this is indeed strange. Some of the results make sense, e.g., the blue curve that has f(α) below 1. strangely this is the negative side of the q values, which is usually where the results are less accurate.

Could you check one thing for me? Can you run:

pip install --upgrade MFDFA

just to make sure you have the latest package?

Besides that, what could lead to these results, in my opinion, is data that is too short or the limits that you are using being too close to each other or too close to 0... Can you fiddle around with that and see what comes out?

Cheers!

mikemelon commented 1 year ago

@LRydin Yes I have updated to the newest version. I replaced order=1 with order=4 to 7 in calculation of Fq(s), the situation is better. After that, some of the $f(\alpha)-\alpha$ curves are not distorted , but there are still some $f(\alpha)-\alpha$ curves that open upward. I implemented MFDFA algorithm on my own independently and it remains the same。 The length of the series does not matter, because I mannually repeat the series twice or more, everything remains unchanged. I changed the limits either it remains the same. I also use the guide in {Espen A. F. Ihlen, 2012, Introduction to Multifractal Detrended Fluctuation Analysis in Matlab} using MATLAB step by step but the results are similiar... (There are two implemention of MFDFA in this article I have tried the first one) I think the main reason perhaps lies in the slope fitted in the Fq(s) calculation, as you point out, the H(q) should decline when q increases. The strange distored curves do not follow this rule. Can it be better to use EMD or Wavelet in MF-DFA implemention, or do you have any advice , direction, or articles, please. Thank u in advance. BTW, how can I find your contact info (email, etc), mine is mikemelon@sina.com Best wishes!

LRydin commented 1 year ago

Hey @mikemelon, my email is hidden in the contributions.md, but I'm writing to you directly from my email. If you have access to MATLAB, then I definitely suggest trying out a wavelet analysis, as that is an equivalently powerful tool to analyse multifractality. If you are seeing similar results this likely points to some details in your data, e.g., low precision or being too short, but besides that, I can't really think of anything else :/.

settwi commented 10 months ago

Is the singularity spectrum code implemented? I would like to compare it with a WTMM analysis. Regards William

LRydin commented 10 months ago

Hey @settwi, sorry for the delay, I was absent this past week. Yes, the singularity spectrum should be working (there might be some kinks) right here (L.32)

To get it to work, run

from MFDFA import MFDFA
from MFDFA.singspect import singularity_spectrum

then run your MFDFA analysis and use that function. There is also a plot helper (if you are using matplotlib) called singularity_spectrum_plot at L307

Check if that helps!