 nus-se-bot
commented
5 months ago
nus-se-bot
commented
5 months ago Team's Response
No details provided by team.
The 'Original' Bug
[The team marked this bug as a duplicate of the following bug]
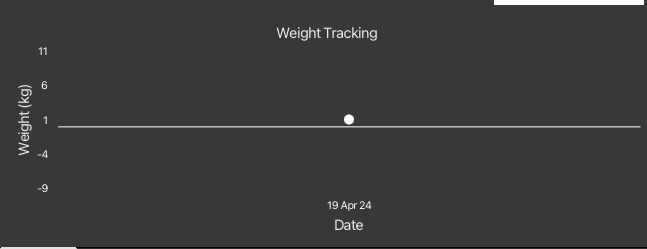
Graph of weight shows negative numbers
Overview If a low enough weight is added, the graph shows a y axis with negative values, which is a bit confusing.
Steps to reproduce
- Start up the application with at least one contact.
- Enter commands:
edit 1 w/1
Expected behaviour
- Shows a graph with only positive y axis.
Actual behaviour
- Shows negative values.
Potential solution Could plot a graph that the lowest y value is 0, so it doesn't show the negative area.
Screenshots
[original: nus-cs2103-AY2324S2/pe-interim#3244] [original labels: severity.Low type.FeatureFlaw]
Their Response to the 'Original' Bug
[This is the team's response to the above 'original' bug]
It is a valid issue, but fixing it is less important than the work done in the current version of the product.
Items for the Tester to Verify
:question: Issue duplicate status
Team chose to mark this issue as a duplicate of another issue (as explained in the Team's response above)
- [ ] I disagree
Reason for disagreement: [replace this with your explanation]
## :question: Issue response Team chose [`response.NotInScope`] - [ ] I disagree **Reason for disagreement:** [replace this with your explanation]
Weight graph can appear with negative numbers, even though negative weight is not possible.
To replicate:
weight 1 100(have at least one other weight)weight 1 0.001