Open kaixiong opened 1 year ago
I would like to add some inspiration from projects on GitHub with pictures that do spectrum analysis with C/C++ code:
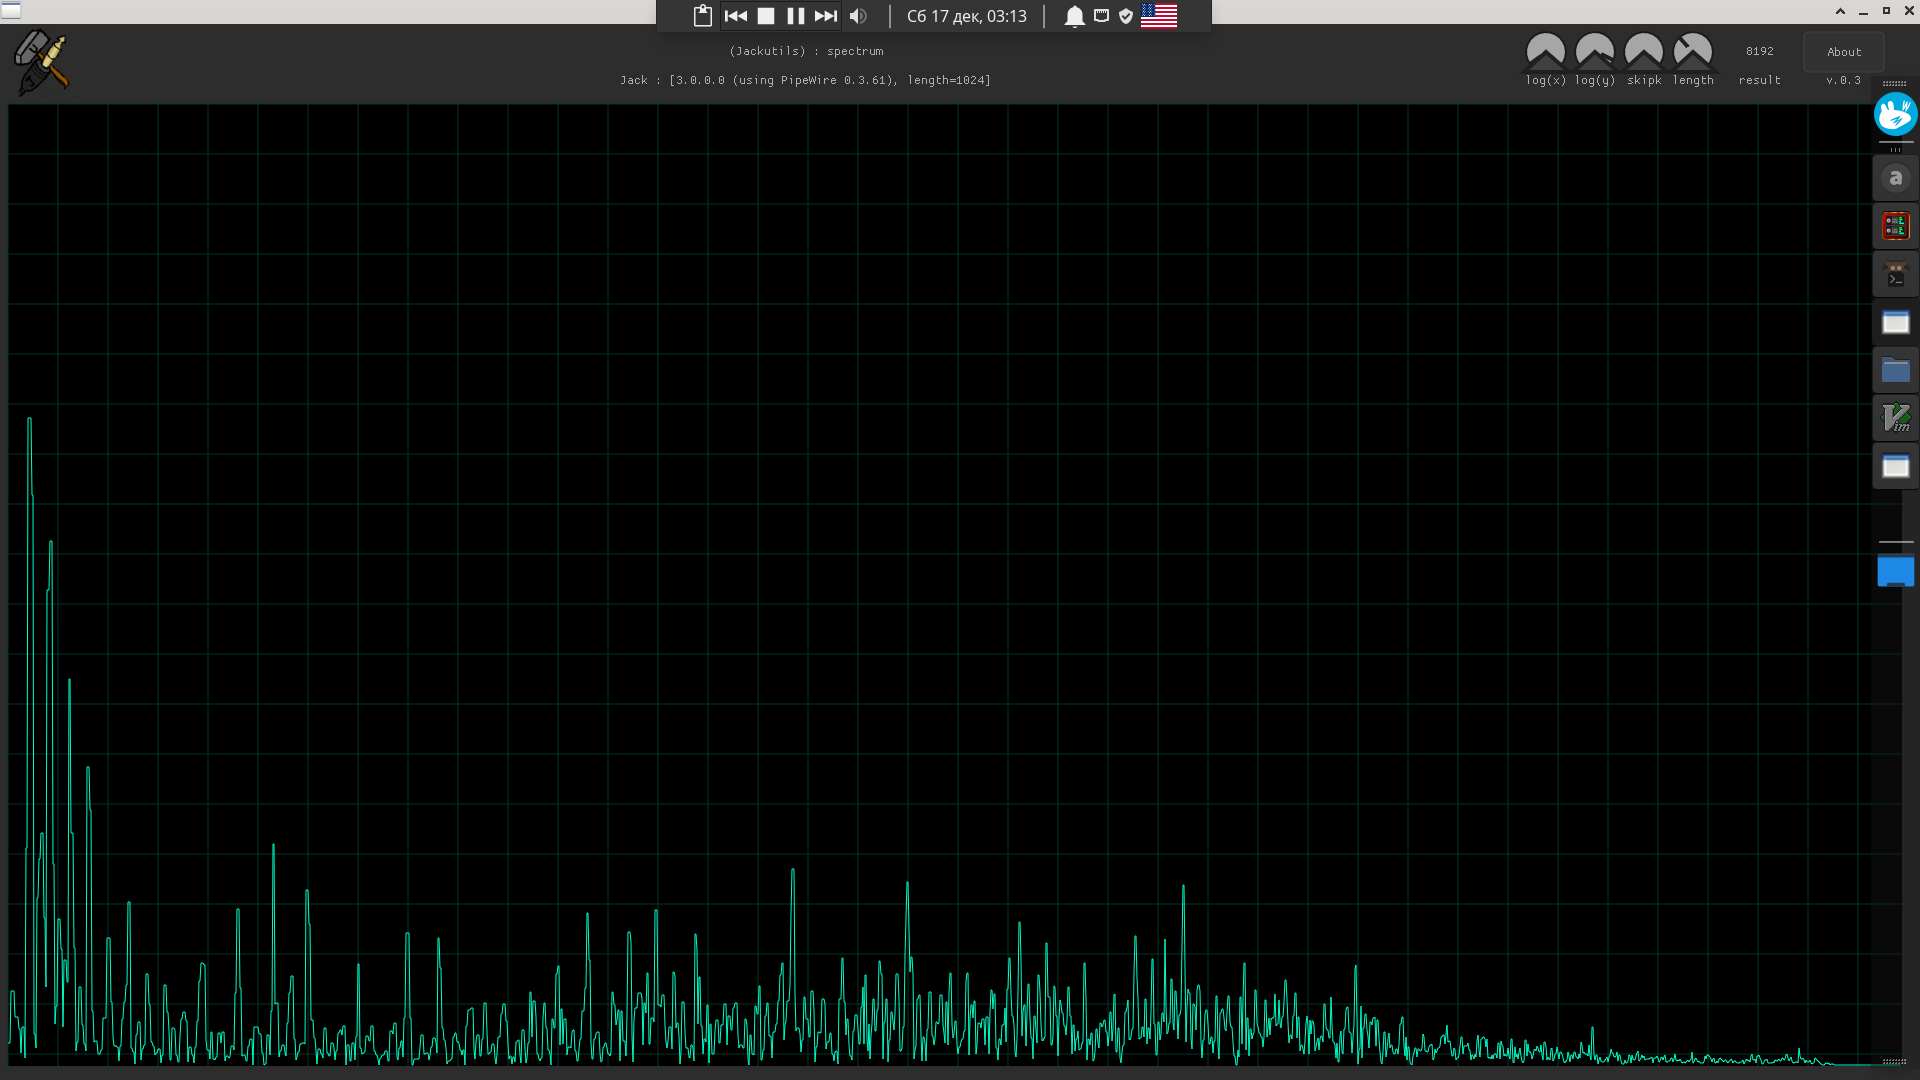
(while the line rendering could be improved)
(though neither the colors nor the symmetry seem to be a good idea)
One more, this is from https://github.com/pckbls/pulseviz , shots are self-made. The licensing would need to be clarified though.
@hartwork, thanks for the ideas. I'm working on the code to rasterise lines and circles. I have done both before. Currently doing research on how to add anti-aliasing to them. Let's see what I can come up with once I have these two graphics primitives to work with.
@kaixiong sounds good, looking forward to see your own spectrum analyzer in action!
I think long-term I'd want us to also port some of the existing ones seen above to (and into) Libvisual as well if licensing can be clarified, I'm thinking of (parts of) both https://github.com/JanKleprlik/AudioVisualiser and https://github.com/pckbls/pulseviz in particular. I hope we can have multiple spectra in libvisual-plugins, a spectrum family :smile:
If your work on anti-aliasing has any likely cross-over to GL vidoptions (get_video_attribute_options
), please let me know, so we don't duplicate work about it in the future by accident.
@kaixiong sounds good, looking forward to see your own spectrum analyzer in action!
I think long-term I'd want us to also port some of the existing ones seen above to (and into) Libvisual as well if licensing can be clarified, I'm thinking of (parts of) both https://github.com/JanKleprlik/AudioVisualiser and https://github.com/pckbls/pulseviz in particular. I hope we can have multiple spectra in libvisual-plugins, a spectrum family smile
@hartwork Sounds good to me!
If your work on anti-aliasing has any likely cross-over to GL vidoptions (
get_video_attribute_options
), please let me know, so we don't duplicate work about it in the future by accident.
The rasterisation and anti-aliasing is done entirely in software so there's no overlap with OpenGL. I miss doing software rasterisation and it's a bit of a fun distraction for me.
@kaixiong :smiley: Thanks for the clarification! :+1:
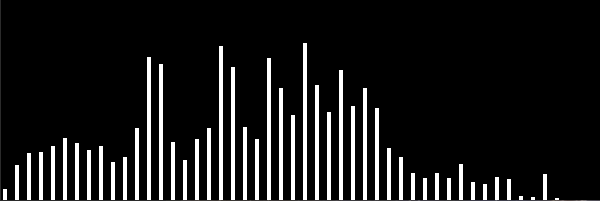
lv-analyzer plots the frequency spectrum in a bar graph and a bit hard to love at the moment (#207). For me, it's been relegated to a sort of visual debugger for audio inputs in Libvisual.
It's boring because the frequency spectrum doesn't see that much movement unless you're listening to sound like this where there's energy shifts up and down the spectrum.
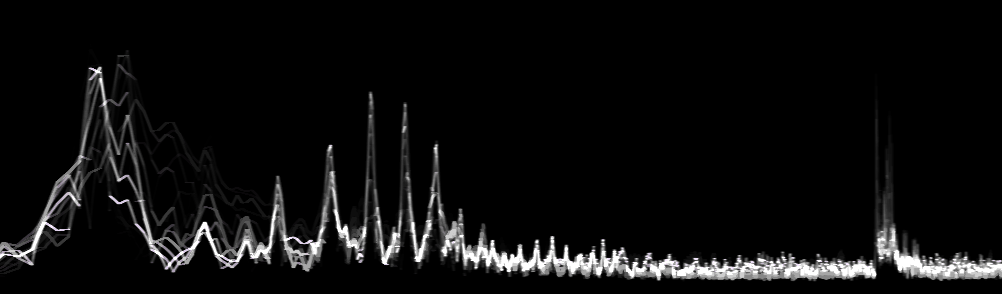
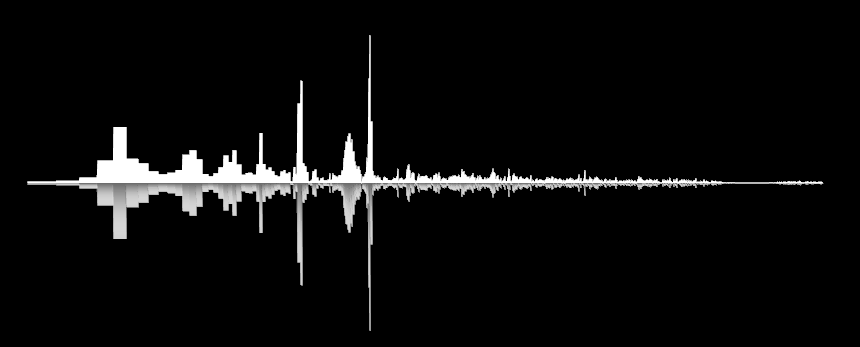
We could superimpose a plot of the audio signal over it, add ghosting/fading, render the bars in a more stylized (less blocky) fashion, and so on. Here are some reference styles:
Another idea that's been brought up in the past is to scale the axes logarithmically so it doesn't look as lopsided. Vertical scaling is straightforward. Horizontal scaling will require the use of a longer signal so that the DFT can produce higher resolution i.e. more samples. These samples can then be put into log-sized buckets (wider band towards higher frequencies), summed and scaled accordingly.