 CommonClimate
commented
2 months ago
CommonClimate
commented
2 months ago fixed by @jordanplanders in #588
Closed CommonClimate closed 2 months ago
CommonClimate
commented
2 months ago fixed by @jordanplanders in #588
I'm not sure exactly with what MPL update this started, but
Series.plot()no longer shows a legend like it used to. To reproduce:Should yield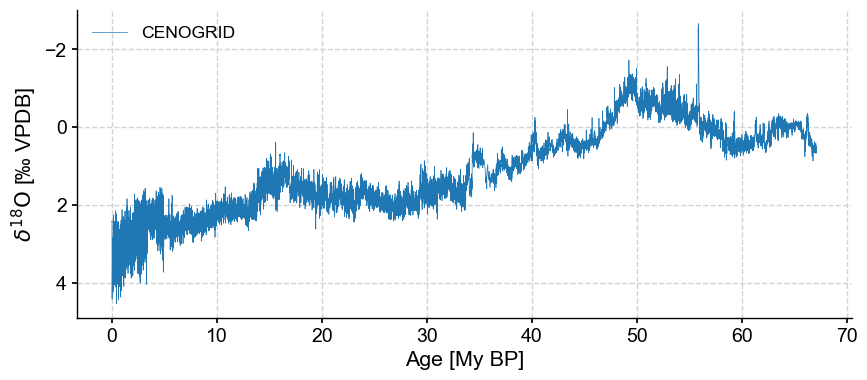 but instead yields this on my machine (conda envt created from the current version of
environment.yml: