 CommonClimate
commented
1 year ago
CommonClimate
commented
1 year ago Update: Dan Lunt called the AR6 Fig 3.2 to my attention:
 . This would be a great figure to reproduce in this workflow (in general terms). To simplify, we could focus on LMR2.1 as the background , and put up whatever PMIP4 GMST we have (e.g. MPI past2k). An interesting application would be to show how to plot not just GMST, but e.g. JJA temperature at PAGES 2k sites, showcasing xarray selection semantics (e.g.
 isel).
This should be straightforward to do once LMR2.1 is cloud-hosted. In the interim, we can use the netCDF file for PAGES 2k (2019) that @fzhu2e generated.
 jordanplanders
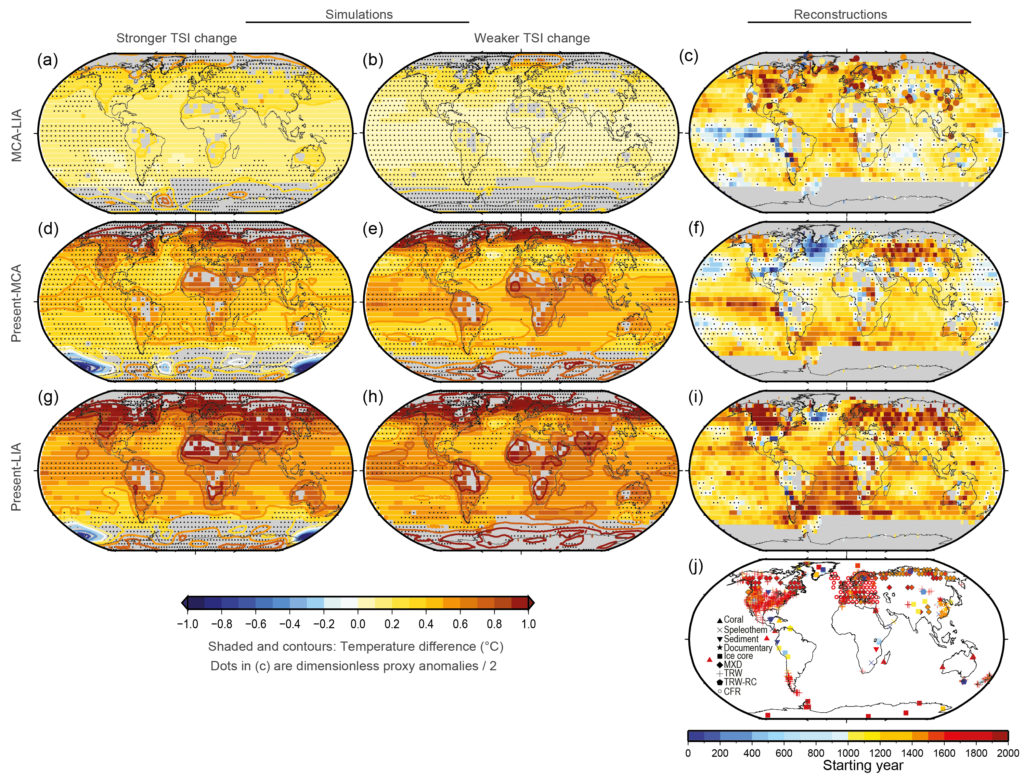 .
.
Hi @jordanplanders ! You will have the honor of inaugurating this repo with a brand new tutorial: Model-data comparison over the Common Era (see the "Climate of the Past Millennium" section of the proposal), leveraging recent additions to the Cloud.
Here is what @khider and I thought would be good to try:
MPI-ESM1-2-LR.past2k.r1i1p1f1past2k experiment surface air temperature data, now available in the cloud (thanks to our awesome pangeo-forge colleagues). It is available here, and I have personally tested the following code chunk:dataset_public_url = 'https://ncsa.osn.xsede.org/Pangeo/pangeo-forge-test/prod/recipe-run-820/pangeo-forge/cmip6-feedstock/CMIP6.PMIP.MPI-M.MPI-ESM1-2-LR.past2k.r1i1p1f1.Amon.tas.gn.dummy.zarr' mapper = fsspec.get_mapper(dataset_public_url) ds = xr.open_zarr(mapper, consolidated=True) ds ds['tas'].mean(axis=0).plot()