While developing the orchestrator, the logging in Javascript/Node shows up in VSCode debug console as originating from console.js:<line#> as shown in the image below:
The actual source that would be needed to investigate the error could be found in the Sentry Web-GUI, but it does not seem to update in real time.
This is a bit annoying and slows down work but seems like an easy fix. Maybe change some parameter in Sentry initialization?
While developing the orchestrator, the logging in Javascript/Node shows up in VSCode debug console as originating from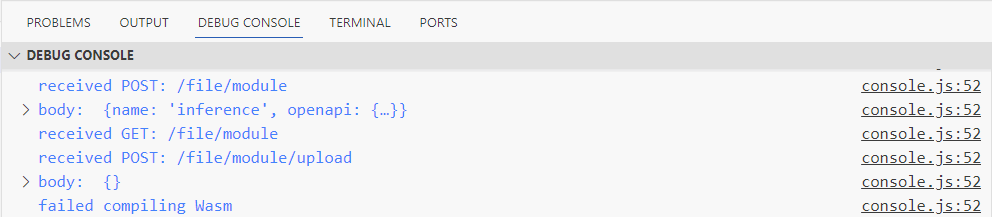
console.js:<line#>as shown in the image below:The actual source that would be needed to investigate the error could be found in the Sentry Web-GUI, but it does not seem to update in real time.
This is a bit annoying and slows down work but seems like an easy fix. Maybe change some parameter in Sentry initialization?