LoopKit / Loop

An automated insulin delivery app for iOS, built on LoopKit
https://loopdocs.org
Other
1.51k stars 1.3k forks source link

Support of FIAsp insulin curve #388

Closed CrushingT1D closed 7 years ago

CrushingT1D commented 7 years ago

Add setting to select type of insulin A) Novo/Humalog B) FIAsp

If A selected use current curve calculation If B selected use maths to match curve as described on page 12 of http://www.ema.europa.eu/docs/en_GB/document_library/EPAR_-_Product_Information/human/004046/WC500220890.pdf

sulkaharo commented 7 years ago

@dm61 <3 the constant AUC of the latest model. td=360 seems very long though? What was the td for the first pass model with the good curve fit, it's not mentioned in the post with the first curve fit images? When comparing the first model with the latest, with peak set to 55, the new new peaks at a much higher activity level than the previous model and the peak at 75 minutes, the new model peaks at a lower value, which makes me wonder which one is more correct. I'd assume people would like to set the td to somewhere between 4 to 5 hours?

old vs new

dm61 commented 7 years ago

@sulkaharo there was no td parameter in the first pass model. Instead one would just chop off the activity curve at some point (which would define DIA). That works well for FIASP, not so well for Novolog, plus it does not have full flexibility in adjustments of peak time and duration. The new model adds a linear decay to the activity curve so that it is forced to zero at td. Good fits to published data have long td, because that's just how the data look like - note how FIASP data points show visible activity even at 300 min. If I get a chance to test out the models for real, I'd probably start with tp = 55min and td = 5 hours for FIASP, 75min and 5 hours for Novolog, and adjust up or down based on observed data.

sulkaharo commented 7 years ago

@dm61 Yeah, I meant the original curve probably was modeled for a specific DIA. :) Guess the adjusting of the parameters from user perspective would be to change the peak location based on observed absorption speed and then change the sensitivity to correct more (or less) before touching td (DIA) to retain the tail in the model.

Anyone have ideas on 1) how to facilitate users understanding the new model and 2) help people gather data that'd support dosing decisions (as in, what parameters to adjust). I suspect most people will try to forcefully use their old DIA and not understand how this works.

ps2 commented 7 years ago

@sulkaharo I'm not completely sure yet, but for Loop, I think it will require new configuration parameter entry, and Loop will not go green until they've made the new configuration.

As for understanding the model, I would provide graphs that compare the old activity/iob curves to the new ones they can select from. Parameter fitting from observed data is something I might be able to expose at some point, but currently I'm looking it as an internal tool. Initially I think we would provide a limited set of selections, with an option to override in code if needed.

jeremybarnum commented 7 years ago

@sulkaharo I agree that helping people use this the right way is quite important and is not easy. I think that for the people willing to do it, an offline experiment to calibrate parameters would be great. Earlier in this chain I posted a crude Excel tool to do this with the Walsh curves but of course it's easy to modify to work with whatever functional form is eventually chosen. It's also easy to imagine (but harder to execute!) a utility within Loop that identifies good opportunities to test the DIA and gives the user the option to do the test, as was discussed here.

For those who don't want to bother with the experiment, some default values will have to be provided. For Novolog, something that matches Walsh curves with DIA between 3 and 4 is probably close to what many are using now.

dm61 commented 7 years ago

@sulkaharo, @jeremybarnum, @ps2 I've also been concerned about how to help people transition from DIA thinking to these new curves and the requirement to enter yet another additional parameter (peak time). One approach would be to retain old-style DIA, which most people set to 3-4 hours, and then internally set td to say a 50% longer value. The peak time should be user-adjustable, but in a relatively narrow range around pre-defined default values, for example 50-80 for rapid, with a default of 75, and 40-60min for FIASP, with a default of 55. There are of course future auto-tuning opportunities here as well.

jeremybarnum commented 7 years ago

@dm61 your comment raises a point I've been thinking about in terms of whether in that type of example, the prediction would go to the DIA or to the longer td. Say for the sake of argument we wind up with a really good Fiasp curve that has a nice early peak but also a realistic tail that is longer than many peoples' current DIA of around 3.5. If we assume that the forecast will always go to the end of the "true" DIA, I wouldn't be surprised if people felt the dosing became a bit too conservative. Say the new curve finishes at 5 hours, I can imagine wanting to keep the prediction at 3.5 hours, and letting low temping deal with the tail. It's admittedly a little riskier, but within certain constraints it might be make sense to consider.

Stylized example: assume the tail is of the order of 10% of the dose after 3 hours. Assume a fast burning meal of 42 carbs with an I/C of 7, an ISF of 70, and a target of 100. The full bolus to the end of the 5 hour DIA would be 6 units, assuming no R/C and no momentum. The prediction at 3 hours would be 142, because only 90% of the insulin has hit, so there is 10%(bolus = 6)(ISF =70) left. To hit the target at three hours, the bolus would be increased to 6.6U. That leaves an extra .6 units in the tail over the course of 2 hours, or .3 units/hour, that needs to be offset with low temping. If you assume a basal rate of, say, .65U/hr, the low temp required is 46% of the basal, which seems relatively safe, but obviously is a matter of preference and risk appetite for lows.

Worth noting that whether we acknowledge it explicitly or not, if we assume the published Novolog data is right (i.e. there is activity out to 5+ hours) and that many people are using shorter DIAs than that because it works out well empirically (rather than because their true, actual DIA is really that short and there is no tail), then this is actually happening today.

dm61 commented 7 years ago

@jeremybarnum you are reading my thoughts! Assuming we adopt DIA < td approach, I think it would be better to let Loop look DIA ahead in dosing calculations, while internally having a longer td that better accounts for the tail end of insulin activity. Looking at the great new visualization offered by the dynamic carb Loop, I have no doubts that the insulin tail does extend beyond Walsh model DIA (well, at least in my case).

jeremybarnum commented 7 years ago

@dm61 if I could read your thoughts I would be MUCH better at math than I actually am 😄. But your comment about the dynamic carb screen reminds me of a related thought I've been having about dynamic carbs. The new screen creates a positive feedback loop for users that allows absorption time estimates, at least for known, recurring meal types, to get increasingly accurate. In that context the 50% buffer on absorption times in the prediction, especially for long absorption times outside the DIA, might start to seem a bit too conservative. @ps2 already supplied an easy way to override that in the code, but it could also be interesting to have that configurable at meal time - essentially a "high confidence" option that would remove the 50% buffer for a given meal. Of course the user can just put in an artificially shorter absorption time in those cases, so I guess this is a pretty low priority suggestion, but...

ps2 commented 7 years ago

I don't like the idea of having two different insulin duration terms, but I think the points raised above are valid. I think they may bring to a head the fact that dosing purely off the forecast at DIA does have some limitations. Namely, that it's possible that dosing an amount of insulin to bring the forecast at dia into range may produce a forecasted low at some point before DIA. This updated curve will make those situations more common, both because the activity early on will be stronger, and when carbs are active, it will try to cover more carbs, making Loop more aggressive. Conversely, by expecting more insulin action out further in the future, Loop will at times be more conservative. I think those separate changes in behavior might each call for different adjustments to loop. For the first case, It might be that we require an iterative dosing algorithm that re-evaluates the forecast as if the dosing recommendation was implemented, and reduces the recommendation if a low is predicted. For the second case, I'm not sure how to deal with it, but am actively thinking about it.

sulkaharo commented 7 years ago

Btw I just noticed I've accidentally been running the first model on our dude with 4 hour DIA and it's been working extremely well. Makes me wonder if kids absorb the insulin faster; the published Fiasp study was afaik strictly adults only.

eszcloud commented 7 years ago

As @ps2 just said, I don't like multiple insulin duration terms. Along those lines, I also think that it's important not to obscure the actual term that we're dealing with (e.g. having people input DIA but turning that into td behind the scenes) because that becomes very confusing.

One idea for dealing with the valley-and-peak situation @ps2 describes above is to incorporate Loop's future actions into the algorithm determining insulin dosing for the present moment and also to incorporate additional terms that are optimized, such as figuring out the dose to maximize how much BG is in range and to minimize dBG/dt. In this scenario, it's important to emphasize the effects of nearer term values as that's when the prediction is the most accurate.

Since the accuracy of such predictions is paramount, before implementing either of those, however, I think that we would want to have a dynamic insulin sensitivity factor to make predictions more accurate.

sulkaharo commented 7 years ago

Did some curve fitting and the curve we're on right now is the same as the latest @dm61 curve with td = 600 and peak = 44, except we're cutting the calculation at 240 minutes, where the activity is ~6% of the peak

ps2 commented 7 years ago

@sulkaharo I have a ML based model that fits CA and Insulin terms over lagged variables for 5 minute intervals over 6 hours (144 terms: 72 each for insulin and carbs), and can run it on weeks of data, so I can get an objective sense of what actual observed insulin activity and (averaged) carb activity is. I've run it on 4 kids and 1 adult so far, all on Novolog. I see faster time to insulin activity peak for kids (50min) than the adult (75min), and I'm guessing that effect would also apply to Fiasp.

jeremybarnum commented 7 years ago

I agree two DIAs is not what we want. But in reality that's not what we're talking about. We're saying there is one DIA - the real one - that's probably longer than then one many people are using. And then another parameter, which is the prediction horizon. Today, that equals the DIA, for very good reasons. But the combination of faster acting insulin and more accurate IOB curves with longer tails puts pressure on that convenient simplification.

@ps2 I do sort of think that we already have tentative near-solutions for each of your cases? Isn't the predicted early low case already, to significant degree, captured by BG guard? The only enhancement needed is for the bolus and temp basals to adjust down slightly - which I guess is your iterative point. But initially at least for boluses the user can do it manually. And I think your second scenario is essentially also naturally captured - if shortening the prediction horizon inside the DIA will create a low in the tail, BG guard will catch it, so it's just a matter of feeding that back into the recommended dosing. The nuance is risk appetite for lows in the tail - that could be a configurable sort of thing that constrains the low temping needed as a % of the basal rate, as in my example. Devil in the details I know and I imagine coding the iterative stuff can be tricky but conceptually I think all the building blocks are in place already.

sulkaharo commented 7 years ago

FWIW https://github.com/openaps/oref0/pull/568 now implements @dm61 's generic curve model for OpenAPS. We're looping with the curve with td = 300, tp = 45, Fiasp, 6 yr old kid and the first 12 hours on the model have worked very well.

dm61 commented 7 years ago

@sulkaharo Thanks for the update. I suggest you look at the difference between deltaBG and modeled insulin impact on BG (which I think is reported by OpenAPS as BGI). The difference represents counteraction effects. among which carb impact is expected to be the strongest factor after a meal (but watch out for exercise effects). So, after a meal, in the absence of exercise, any systematic negative values of the counteraction=deltaBG-BGI may imply that the underlying insulin activity model is off. The new Loop gives us a real-time view of the counteraction effects. With Walsh curves currently used in Loop, I have observed strange dips about 1-2 hours after a meal (which led me to think that Walsh curve peak comes too late), as well as fairly consistently negative counteraction 4-5 hours after the meal, implying too short tail of the Walsh curve. The hope is that the new curves model insulin absorption better, which we should be able to assess by looking at counteraction data.

tim2000s commented 7 years ago

One of the things I'm struggling with with these curves compared to the published data is the Insulin clearance. The published data states 57 mins mean half life, while the IOB curves that are generated from these activity curves works out at about 90 mins, so our understanding of activity vs clearance is not quite right. It may require us to make some minor variations to our IOB calculations.

dm61 commented 7 years ago

@tim2000s parameters in the exponential curves can be selected to match published activity curves very well. The published half-time value must be coming from different experiments done under different measurement conditions. We could try to tweak the parameters (peak time tp and duration td) to get a better balance with respect to various published data. Or, we could try to find entirely different curves. However, I'd strongly caution against ad-hoc tweaking just IOB(t) or just Ia(t) separately. These two are related (one is just an integral of the other), and IMO we should keep them strictly consistent in any algorithm implementation.

tepidjuice commented 7 years ago

Sorry to have missed most of this discussion. I've been on holiday. It looks good. The pedant in me is pleased to see the non-integer n have gone :).

Given that what we're doing is finding different approximate solutions to:

x' = -ax + by (1) y' = -cy + dz (2) z' = -fz + gu (3)

where:

whether you use equation (2) or just use equations (1) and (3), replacing y in equation (1) with z, is pretty arbitrary. A third order system i.e. using all three equations will give a t^2 exp(-t / \tau) like response whilst a second order system will give a `texp(-t / \tau)` like response. I'll use a third order system from here on.

** as this is a linear system the exact position and definition of the parameters a, b, c, d, f and g is flexible.

*** g can also be used to change units and model site specific absorption dynamics.

Would it not be better to implement this for the insulin model? The advantages of this would be:

I'd set the parameters as follows:

In the plot I've done this for S = 3 and S = 4 and g = 0.001 with a peak time of 75 minutes. NB I also set a = 1/75.

download

The rest is a dodgy implementation idea.

To be consistent with current implementations, I'd set u = 0 for a person's normal basal rate i.e. u = I - ub, where I is the actual insulin delivered by the pump and ub is the current basal rate. A bolus would set u to be the magnitude of the bolus.

To work out the effect of temporary basals is a little more complicated. I don't know how this is currently modeled in loop. I would do something like:

  1. A temp. of N u/minute is set for m minutes
  2. Find n = N - ub and calculate r = n*m, so r is the total amount of insulin to be delivered by the temp basal (or as it could be negative undelivered?)
  3. Assume the pump delivers basal insulin continuously
  4. Each time k_now loop runs calculate (k_now - k_previous)*n i.e. the amount of insulin that should have been delivered since the last loop, and set u to this value.
  5. As an error check keep track of w = w - |u|, where w = |r| at the start of the temp basal. If this value is negative then something has gone wrong.
  6. As another error check have E = |r| - n*M, where M is the time elapsed since the basal was started. We should have E ~= w .
  7. If a temp basal is cancelled then this corresponds to changing m and should only affect steps 5 and 6.

We of course would need to descritise the system. In my opinion the Euler descritisation is good enough i.e.:

x(k+1) = (k_now - k_previous) * (-ax(k) + by(k)) + x(k) y(k+1) = (k_now - k_previous) * (-cy(k) + dz(k)) + y(k) z(k+1) = (k_now - k_previous) * (-fz(k) + gu(k)) + z(k)

ps2 commented 7 years ago

For manually testing the model described above in Loop, see https://github.com/LoopKit/Loop/pull/539

tepidjuice commented 7 years ago

I spent a few minutes fitting the ODE's to the novorapid data set. I've included the exponential for comparison. It wouldn't be too hard to get an even better fit if desired.

download 1

francesc0-cgm commented 7 years ago

So @tepidjuice for novorapid is 75 of peak and td of 360? Also in a kid?

tepidjuice commented 7 years ago

@francesc0-cgm I have no idea. I'm just a mathematician. Have you tried searching for paediatric clamp data to fit?

From this: http://www.novonordisk.ca/content/dam/Canada/AFFILIATE/www-novonordisk-ca/OurProducts/PDF/novorapid-product-monograph.pdf

It seems the peak time, t_max is the same in most populations but the peak concentration C_max is higher in children. If this is true it would appear that novorapid is eliminated faster in children than adults. Giving a lower td.

I only know for myself novorapid peaks at 60-80 minutes and has a noticeable effect for 4.5-6 hours. I found this out by getting myself in steady-state, i.e. fasting and with a constant basal rate, then administering a small bolus. I did this overnight.

But if we use the differential/difference equations td would no longer be an important variable. We'd only have to consider ISF and tp.

dm61 commented 7 years ago

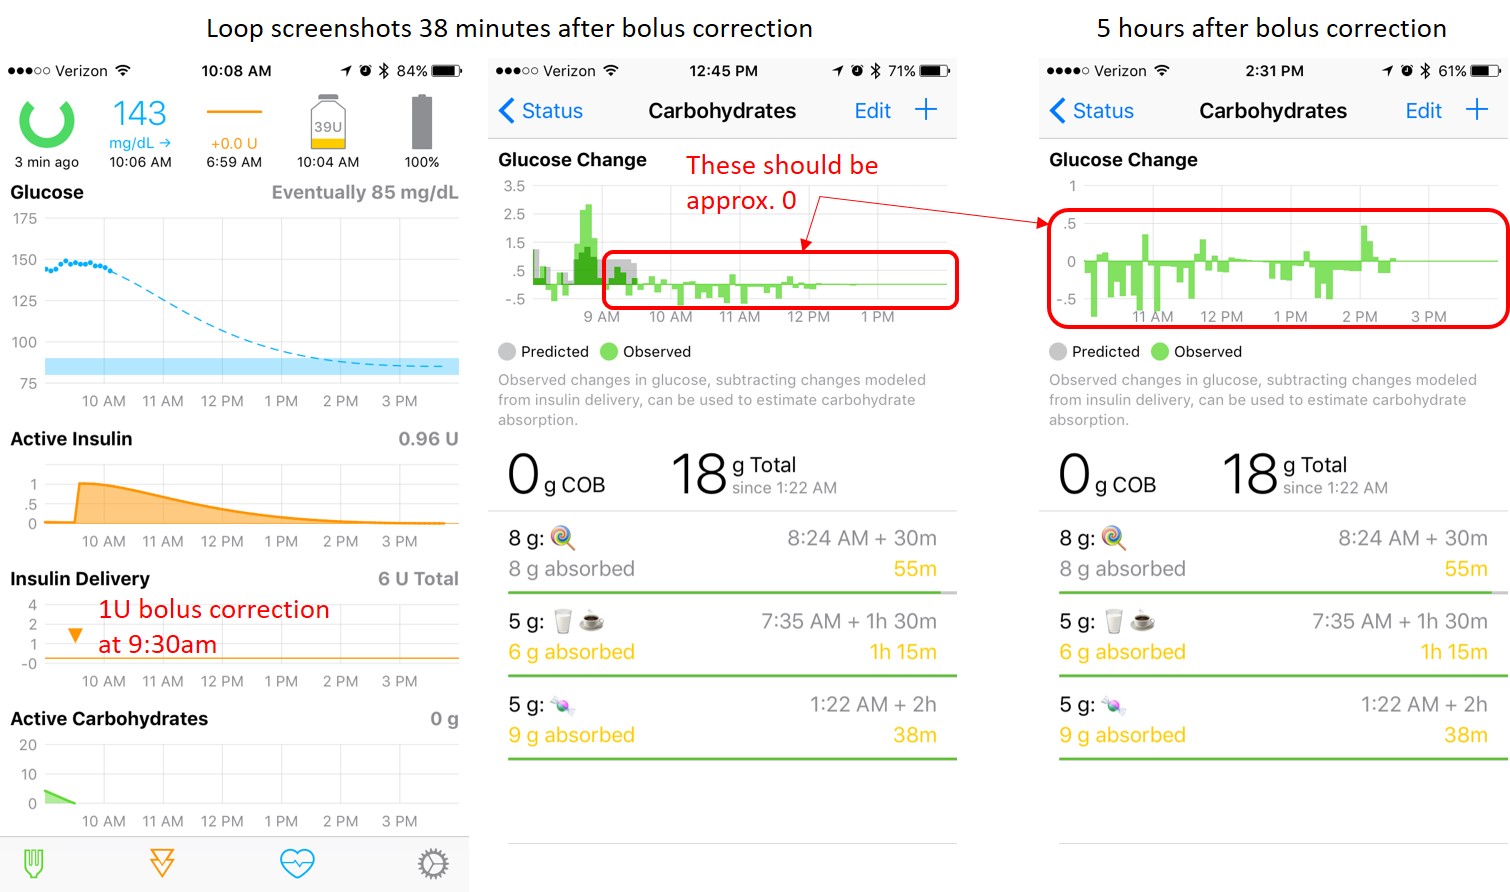
So I've been running the Loop insulin model testing branch #539, with exponential curves, td=360 and tp=75 (Novolog) for couple of days now. This morning I assumed the combined roles of a lab technician and a lab mouse, and performed a semi-controlled experiment: took couple of glucose tablets to bring bg to around 150, waited a bit to get to steady state, and then dialed a 1U correction bolus, while keeping Loop open, and with no food or exercise for the next 5 hours. Below are screenshots illustrating the results. BG started to drop noticeably at around 30min, which seems to be well predicted by the model. The most important graph to look at is Glucose Change (which shows insulin counteraction effect). Ideally, if the modeled insulin absorption curve were perfect, that graph would show zero at all times after the correction bolus. As shown below, not exactly zero, but the values are relatively small and bounce around zero (which is to be expected given bg sensor noise and quantization). A slight negative bias may imply that my ISF or basal rate are a bit off, but that's a different topic.
exp-curves-test-08-01-2017

ps2 commented 7 years ago

@dm61 That graph is beautiful! :) Our insulin counteraction effect chart seems to have cleared up a lot since running the new curves as well.

elnjensen commented 7 years ago

@dm61 Nice experiment!

tim2000s commented 7 years ago

@tepidjuice, @francesc0-cgm insulin clearance in children under clamp conditions has been shown to be more or less the same as that in adults, and that is >5 hours in both cases.

That's why My concern comes about modelling the activity and iob and the relationship between them. There's an additional component that we need to determine given the data we have for half life and activity.

tim2000s commented 7 years ago

To add to my last comment, (sorry on phone with no edit function) - the physiological mechanism for insulin clearance is a combination of insulin activity within the tissues that have insulin receptors (so typically GLUT4 in T1 in peripheral muscle) and also kidney activity. There's a small amount of hepatic clearance but that pretty low in T1. I think our IOB based on activity looks solely at the effects based off insulin activity and ignores the renal clearance, hence why the IOB curve has a slower rate of decay than the published data.

zqf7738 commented 6 years ago

Hello, Thank you very much! But now I have a question about insulin time. I want to ask you. My insulin works faster in the morning, and it can be injected once a day, but the onset time at noon and evening is much slower. It can only be injected first, and the other can only wait an hour after it can be injected. This leads to a closed loop pump system. It predicts high blood sugar. And then press it on the basis of the foundation. The results are easy to cause hypoglycemia. How to solve such a problem. What is the best way to fill in the time of insulin action

scottleibrand commented 6 years ago

Are you using Loop or OpenAPS or something else? Probably best to move this over to Gitter.

freestatelabs commented 3 years ago

If anyone wants to compare parameters in this exponential model against their current Loop curve, here is a python notebook to do so: https://github.com/ps2/LoopIOB/blob/master/ScalableExp.ipynb

Edit the params of the last block, and reevaluate

What physical value does the activity curve represent? Is it blood insulin concentration in [mU/L], etc?

scottleibrand commented 3 years ago

Insulin activity is measured in units of mg/dL/minute or equivalent. It corresponds most closely to the glucose infusion rate in clamp studies, which is in units of mg/kg/minute.

freestatelabs commented 3 years ago

Insulin activity is measured in units of mg/dL/minute or equivalent. It corresponds most closely to the glucose infusion rate in clamp studies, which is in units of mg/kg/minute.

Thanks! And what is the significance of the exponential model curves all having an integral equal to one?

scottleibrand commented 3 years ago

The area under the insulin curve represents the total activity of the insulin, which is calculated using ISF. Having the AUC equal to 1 makes it easy to properly scale it by the ISF.

martinlcz commented 2 years ago

Hello, I would like to ask why pharmacokinetic curves are used to calculate IOB (Serial mean serum free insulin concentration) and pharmacodynamic curves (Serial mean serum glucose collected) are not used. I think the pharmacodynamics better describe the effect of insulin on postprandial blood glucose levels.

CosiP commented 2 years ago

Pharmacokinetics is how insulin is processed by the system/body, so it is the way to know how much insulin is active and how much is not over time. Is my understanding that this is how the insulin activity is calculated. Insulin activity does not depend on how much glucose there is in the system, it depends on how much insulin has been given at a given time. Both are important for sure, but tell different things. May be a clinical pharmacist can explain in better…

On May 13, 2022, at 7:00 AM, martinlcz @.***> wrote:

 Hello, I would like to ask why pharmacokinetic curves are used to calculate IOB (Serial mean serum free insulin concentration) and pharmacodynamic curves (Serial mean serum glucose collected) are not used. I think the pharmacodynamics better describe the effect of insulin on postprandial blood glucose levels.

— Reply to this email directly, view it on GitHub, or unsubscribe. You are receiving this because you are subscribed to this thread.

martinlcz commented 2 years ago

Pharmacokinetics is how insulin is processed by the system/body, so it is the way to know how much insulin is active and how much is not over time. Is my understanding that this is how the insulin activity is calculated. Insulin activity does not depend on how much glucose there is in the system, it depends on how much insulin has been given at a given time. Both are important for sure, but tell different things. May be a clinical pharmacist can explain in better… On May 13, 2022, at 7:00 AM, martinlcz @.***> wrote:  Hello, I would like to ask why pharmacokinetic curves are used to calculate IOB (Serial mean serum free insulin concentration) and pharmacodynamic curves (Serial mean serum glucose collected) are not used. I think the pharmacodynamics better describe the effect of insulin on postprandial blood glucose levels. — Reply to this email directly, view it on GitHub, or unsubscribe. You are receiving this because you are subscribed to this thread.

I understand that pharmacokinetics describe the amount of insulin in the blood, but pharmacodynamics describes how insulin lowers blood glucose, which is of more interest to diabetics.

scottleibrand commented 2 years ago

Do you have a good data source showing how the PD curve differs from the PK curve in a way that would be meaningful for IOB calculations? We used the published curves available at the time, and empirically determined that they worked well, and far better than the crude estimations we (and many insulin pumps) were using previously. There may be opportunities to improve the curve shape further, but I would need to see data indicating how the shape should differ from the exponential approximation we use today.

martinlcz commented 2 years ago

There are few pharmacodynamic studies. So far, I have found that the peak depends on the size of the bolus (the larger the bolus, the later the peak). Most studies of insulin Fiasp and Lyumjev in diabetics are for 15U. In healthy people 7U, 15U and 30U. The "nichi" developer has designed a dynamic model of insulin activity, but it is quite different from the AAPS model, so I wonder if the pharmacokinetic or pharmacodynamic model is correct. Here are some pharmacodynamic curves: https://www.diabetesnet.com/insulins/lyumjev-a-new-fast-acting-insulin/ https://www.ema.europa.eu/en/documents/product-information/lyumjev-previously-liumjev-epar-product-information_en.pdf https://www.researchgate.net/publication/336908971_Fast-Acting_Insulin_Aspart_A_Review_of_its_Pharmacokinetic_and_Pharmacodynamic_Properties_and_the_Clinical_Consequences

nichi - Lyumjev val a0 = 61.33 val a1 = 12.27 val b1 = 0.05185 tp = (a0 + a1 2 bolus.amount)/(1 + b1 2 bolus.amount) - Lyumjev 200U tp = (a0 + a1 bolus.amount) / (1 + b1 bolus.amount) - Lyumjev 200U result.activityContrib = (2 bolus.amount / tp_model) t exp(-t.pow(2.0) / tp_model)` val lowerLimit = t val upperLimit = 8.0 60 result.iobContrib = bolus.amount * (exp(-lowerLimit.pow(2.0)/tp_model) - exp(-upperLimit.pow(2.0)/tp_model))

My version - Lyumjev val a0 = 50 val a1 = 6 val b1 = 0.06 tp = (a0 + a1 2 bolus.amount)/(1 + b1 2 bolus.amount) - Lyumjev 200U tp = (a0 + a1 bolus.amount) / (1 + b1 bolus.amount) - Lyumjev 200U result.activityContrib = (1.86 bolus.amount / tp_model) t.pow(0.86) exp(-t.pow(1.86) / tp_model)` val lowerLimit = t val upperLimit = 8.0 60 result.iobContrib = bolus.amount * (exp(-lowerLimit.pow(1.86)/tp_model) - exp(-upperLimit.pow(1.86)/tp_model))

martinlcz commented 2 years ago

Here is a comparison for different bolus sizes. BLUE - AAPS oref peak 45 min, DIA 7h GREEN - AAPS oref peak 60 min, DIA 7h PURPLE - dynamic model from nichi RED - dynamic model of my modification AI 7U, AI 15U, AI 30U - PD models AI (healthy person) AI 15U dia - PD model AI (DM1) image image image image image image image image

Hazelstar commented 1 year ago

Thanks for sharing this interesting research @martinlcz , I've found myself many times "intuitively" lowering my bolus past a certain large amount of carbs (I rarely bolus more than 6UI / meal in my everyday) because even though my carb ratio is fine tuned, for a big meal with 50/50 high IG and low IG carbs, I would most certainly fall in hypo 3 or 4 hours after the meal+injection, and it's independent of whether I do an extended bolus or not.

I thought I was crazy and wondering if there was any possibility that my carb ratio was nicely tuned for a certain range (say until ~70gr of carbs), and that the more I would eat carbs, the higher it would gradually switch. But I felt it had to do with the insulin activity rather than the CR. (For the context: I was undergoing traditional pump therapy until recently and switched to a closed loop 3weeks ago, the algorithm is a huge help when dealing with those big meals.)

ijustlovemath commented 10 months ago

Hi! Sorry to revive this thread, but I'm implementing IOB in my own loop and was curious about something:

Why does treatment.insulin reflect the total insulin dose given, and not a curve (eg some step function)? Ideally you would convolve the infusion curve (in U/min) with the impulse response (these exponential curves) to get the overall system response, but it seems like all insulin treatments are assumed to be given instantaneously at a moment in time.

Of course, you could take the total dose from an infusion curve and use that as your treatment.insulin, but that seems like it would work less well when your infusion is given over a longer period of time (more than 5 minutes or so).

Anyone have thoughts on this?

ps2 commented 10 months ago

@ijustlovemath Yes, Loop's models are not physiologically accurate in this respect, and you may improve the very short term modeling of glucose a small amount by considering an infusion curve, but since Loop is mostly looking out several hours for dosing calculations, this will have a very small effect on dosing.

ijustlovemath commented 10 months ago

Am I correct in thinking you simply integrate your infusion curves to get the "treatment.insulin" amount?

tepidjuice commented 10 months ago

The treatment curves approximate solutions to a second order linear system of DEs.

From memory these are normalised so the integral is always 1 over a fixed time. Allowing the dose to be a scalar multiple of a fixed function.

This isn't really physiological. Absorption is dose dependent. But it's close enough.

The initial condition is a delta function with magnitude of the bolus. Given the time constant(s) of insulin absorption are quite large you won't see much of a difference if you look at the response to a pulse with a duration of 5 minutes.

For pulses longer than about 10 minutes there'll be a bigger difference but generally we call that basal.

In summary sure the insulin model isn't perfect but there are much larger modelling issues in diabetes and it what we have is simple and works well enough.

On Tue, 19 Dec 2023, 16:21 ijustlovemath, @.***> wrote:

Am I correct in thinking you simply integrate your infusion curves to get the "treatment.insulin" amount?

— Reply to this email directly, view it on GitHub https://github.com/LoopKit/Loop/issues/388#issuecomment-1862970600, or unsubscribe https://github.com/notifications/unsubscribe-auth/AEZQODTN7R3YO6NQD6QNGCTYKGWHHAVCNFSM4DB5YQVKU5DIOJSWCZC7NNSXTN2JONZXKZKDN5WW2ZLOOQ5TCOBWGI4TOMBWGAYA . You are receiving this because you were mentioned.Message ID: @.***>

Alenasot commented 10 months ago

hello! the question's off subject, but may be someone know how to convert 1 U of insulin to mU/min

Sargius commented 2 months ago

http://www.ema.europa.eu/docs/en_GB/document_library/EPAR_-_Product_Information/human/004046/WC500220890.pdf

Hello! This link is broken. Could you kindly send somehow a working link or article itself. I am trying to understand underlying maths and can't find appropriate articles. Maybe this article can help!

Thanks :)