Miksus / rocketry

Modern scheduling library for Python
https://rocketry.readthedocs.io
MIT License
3.25k stars 105 forks source link

memory leak bug #135

Closed wayn111 closed 1 year ago

wayn111 commented 1 year ago

Steps to reproduce the behavior.

# coding=utf-8

from memory_profiler import profile
from rocketry import Rocketry
from rocketry.conds import every

app = Rocketry()

@profile
@app.task(every("1 seconds"),  execution="async")
async def job():
    print(1)

if __name__ == '__main__':
    app.run()

View the dat file in the same directory,memory leaks will be found image

Miksus commented 
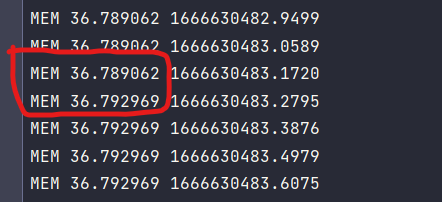
1 year ago

Does your result show memory usage between two different runs of this task? If so, this most likely is not an issue: the accumulation of memory is actually expected.

By default, Rocketry logs the tasks (ie. when a task started, when it succeeded/failed/etc.) to an in-memory list. This is fundamental part of Rocketry as most of the scheduling is based on whether a task started/finished at a given period of time, as does the condition every (though there is some optimization in place by default).

What does the results show if you disable the logger?


from memory_profiler import profile
from rocketry import Rocketry
from rocketry.conditions.api import scheduler_cycles
from rocketry.conds import every

import logging
logger = logging.getLogger("rocketry.task")
logger.disabled = True

app = Rocketry()

@profile
@app.task(every("1 seconds"),  execution="async")
async def job():
    print(1)

if __name__ == '__main__':
    app.session.config.shut_cond = scheduler_cycles(more_than=10)
    app.run()

How did you run the memory_profiler? I tried to reproduce this but couldn't get the output out of the library.

wayn111 commented 1 year ago

mprof run test.py

Miksus commented 1 year ago

I ran it with logging disabled and your results are indeed because the logs are accumulated in memory (which is expected).

I ran Rocketry with the same setup as above but allowing scheduler to be running for 2 min and this is the results:

MEM 1.777344 1666675619.4039
MEM 3.437500 1666675619.5066
...
MEM 3.437500 1666675649.4000
MEM 3.394531 1666675649.5079
...
MEM 3.394531 1666675740.0621
MEM 3.394531 1666675740.1707
MEM 3.394531 1666675740.2785

So for some reason the memory consumption actually decreased after 30 seconds, maybe due to some representation change but after that, it stayed completely the same for the remaining time.

Therefore it seems Rocketry does not leak memory based on this example. It does accumulate memory by default but this is intended. The logs can be manually cleaned (ie. using another task preferably with execution as main) to avoid accumulating those indefinitely.

And thanks for the observations and the effort! This was a good thing to check.

wayn111 commented 1 year ago

I didn't disable logging as shown in my code

Runs every second, I ran maybe 2 minutes, memory is growing and not falling. I can try to disable logging to see if I can solve this problem

Miksus commented 1 year ago

Yes, but there is no problem from Rocketry's point of view. If you append an item to a list, you cannot expect your memory consumption to go down:

l = []
l.append("item")

Appending to the list increases your memory usage and this is not a memory leak, it's standard behaviour. What you observed was exactly the same: Rocketry adds a new log record to the logs which is a list in memory (if no other destination is set). The past logs are vital for Rocketry as many of the core conditions are dependent on the run history. This is by design and it's not a bug. My example proved it's exactly the logging that causes the accumulation of memory thus it's exactly due to this.

Of course, you can direct the logs to a disk or to a database to not keep them in RAM or you could create a task that periodically deletes too old records. Or disable the logging if you don't mind that some of the conditions might not work. The user is free to choose the option that makes the most sense in their situation.