Mindwerks / worldengine

World generator using simulation of plates, rain shadow, erosion, etc.
MIT License
981 stars 127 forks source link

Optional plot library? #204

Open tcld opened 8 years ago

tcld commented 8 years ago

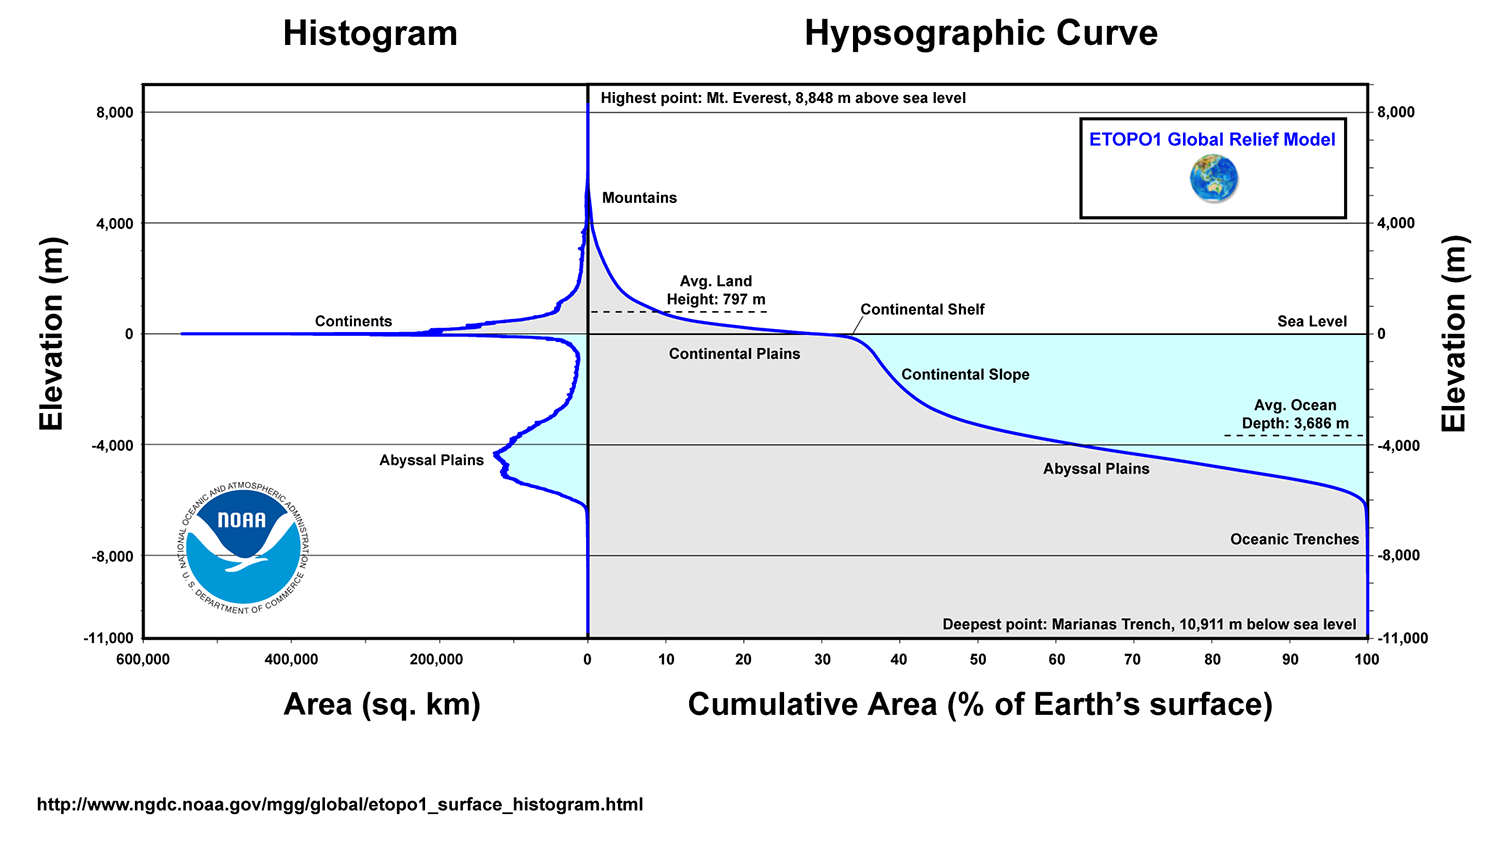
Since we already have @esampson's scatter plot and since I have been trying to add something similar, too - would it maybe be a good idea to move the plot-functions into their own module and make use of a proper plotting-library? I think it could be an optional dependency since it will only interest a few people.

The library I have stumbled upon the most is matplotlib; the code seems to be simple and there are a million examples that would hopefully make it very easy to make use of the library.

This could be used in conjunction with numpy.histogram, so certain plots could be done very quickly and within a few lines of code.

esampson commented 8 years ago

Yeah. I'm all for moving it to a separate module. As mentioned earlier I would kind of like to offload all drawing to separate modules and give people complete control over what drawing modules are called or not called (with the addition that we put a group of modules in as the default options so that new users don't generate only a world file and then wonder what to do with it).

tcld commented 8 years ago

Topical separation sounds good, but a module for every drawing function might be overkill. Aside from the ancient map-drawing (which occupies its very own module already) none of it is complicated enough to justify its own module, in my opinion. You would just be left with a lot of files and imports. If WorldEngine were to grow a lot, though, separation might become an important topic.

If you want to give control to the user, let's start working on a well-documented file that contains all the variables used during generation and drawing. That would increase control tenfold and make things a hundred times easier for people who aren't familiar with the code or Python in general.

And on topic: Moving things to something like draw_plots.py would be a start, but I would really like to see proper plots with labeled axes etc.

ftomassetti commented 8 years ago

I would make dependencies optional only if the involve native libraries, otherwise pip can install stuff quite easily and having the extra complication of optional stuff could be not worthy.

I suggest we start moving stuff to draw_plots.py. Later we may create a subdirectory named plots with:

But probably we will able to understand what to generalize when we start having more than one plot.

As we produce more output we should probably think about better options to control it. Something like:

And perhaps some plots enabled by default.

tcld commented 8 years ago

I don't even know if matplotlib uses any native libraries. But I will find out once it is necessary. As soon as some other PRs are out of the queue, I will move things to a draw_plots-module.

tcld commented 8 years ago

It seems that matplotlib might not be trivial to install, although pip install matplotlib worked for me (for both Python 2 and 3). On top of that, the matplotlib-package is quite large (54 MB) - I'm not sure if that factors in to anything.

So maybe a different plotting library would be better? Until then I will try to look at matplotlib a bit more.

tcld commented 8 years ago

Well, it looks quite nice. hypsographic_28070

Here the original from http://www.ngdc.noaa.gov/mgg/global/etopo1_surface_histogram.html: Earth

Also, something like this could be useful.