NVIDIA / DALI

A GPU-accelerated library containing highly optimized building blocks and an execution engine for data processing to accelerate deep learning training and inference applications.
https://docs.nvidia.com/deeplearning/dali/user-guide/docs/index.html
Apache License 2.0
5.17k stars 622 forks source link

Errors when converting a Dali tensor to a pytoch tensor #3972

Open Weigaa opened 2 years ago

Weigaa commented 2 years ago

Hi, guys. I tried to combine DALI with the torch.autograd.graph.saved_tensors_hooks(pack_hook,unpack_hook) API to speed up the offloading and prefetching of intermediate feature maps to SSDs. I converted the Pytorch tensor to numpy for storage on the SSD during forward propagation, and used pipe_gds() to fetch back to the GPU during backward propagation, then completed the DALI Tensor to Pytorch via nvidia.dali.plugin.pytorch.feed_ndarray() Tensor conversion. When executing the feature map generated by the convolution layer, some errors occur and the error output is as follows.

(wjpytorch) root@li:~/wj# python test_with_hook_gds.py
Files already downloaded and verified
train_data_size:50000
cuda:0
Number of parameter: 0.14 M
Memory of parameter: 0.56 M
--------------The 1 training begins----------
inputimages type is torch.Size([64, 10])
inputimages type is torch.Size([2560, 64])
successfully free 7d4e1136-ed45-4a2c-9afd-ad109689260b.npy
successfully free 7c970ca2-82b1-43f2-87ac-4df69e35a576.npy
inputimages type is torch.Size([1024, 64])
inputimages type is torch.Size([2560, 1024])
successfully free 4375fe98-b486-418e-b70e-74e80de8cf99.npy
successfully free bf5766bb-3f17-4df0-a7c8-5fe7d17e0c3b.npy
inputimages type is torch.Size([2560, 64, 8, 8])
Traceback (most recent call last):
  File "/root/wj/test_with_hook_gds.py", line 123, in <module>
    loss.backward()
  File "/root/anaconda3/envs/wjpytorch/lib/python3.9/site-packages/torch/_tensor.py", line 363, in backward
    torch.autograd.backward(self, gradient, retain_graph, create_graph, inputs=inputs)
  File "/root/anaconda3/envs/wjpytorch/lib/python3.9/site-packages/torch/autograd/__init__.py", line 173, in backward
    Variable._execution_engine.run_backward(  # Calls into the C++ engine to run the backward pass
RuntimeError: AssertionError: The element type of DALI Tensor/TensorList doesn't match the element type of the target PyTorch Tensor: torch.int64 vs torch.float32

At:
  /root/anaconda3/envs/wjpytorch/lib/python3.9/site-packages/nvidia/dali/plugin/pytorch.py(55): feed_ndarray
  /root/wj/test_with_hook_gds.py(59): unpack_hook

I'm not sure if this is due to DALI or the Pytorch API, when I use torch.load() directly to read a Pytorch tensor file, no errors occur. Could you give me some suggestions for adjustments?

The reproducible code is as follows:

import os
import time
import uuid
import inspect
import torch
import torch.nn as nn
import torch.nn.functional as F
import numpy as np
import torchvision
from torch import cuda
from nvidia.dali import pipeline_def, fn
import nvidia.dali.plugin.pytorch
from torch.utils.data import DataLoader

device=torch.device('cuda:0')

#pynvml.nvmlInit()
#frame = inspect.currentframe()
#gpu_tracker = MemTracker(frame)

train_data=torchvision.datasets.CIFAR10(root='./data',train=True,transform=torchvision.transforms.ToTensor(),download=True)
#test_data=torchvision.datasets.CIFAR10(root='./data',train=False,transform=torchvision.transforms.ToTensor(),download=True)

train_data_size=len(train_data)
#test_data_size=len(test_data)
print("train_data_size:{}".format(train_data_size))
#print("test_data_size:{}".format(test_data_size))

train_dataloader=DataLoader(train_data,batch_size=2560)
#test_dataloader=DataLoader(test_data,batch_size=128)

'''hook'''
class SelfDeletingTempFile():
    def __init__(self):
        self.name=os.path.join("",str(uuid.uuid4()))
    def __del__(self):
        freefilename = self.name +'.npy'
        os.remove(freefilename)
        print("successfully free " + freefilename)

@pipeline_def(batch_size=1, num_threads=8, device_id=0)
def pipe_gds(filename):
    data = fn.readers.numpy(device='gpu',file_root='.', files=filename)
    return data

def pack_hook(tensor):
    temp_file=SelfDeletingTempFile()
    tensorshape = tensor.shape
    Inputnumpy = tensor.cpu().numpy()
    np.save(temp_file.name,Inputnumpy)
    file = [temp_file, tensorshape]
    return file

def unpack_hook(file):
    Inputimages = torch.zeros(file[1]).to(device)
    p = pipe_gds(filename=(file[0].name+'.npy'))
    p.build()
    pipe_out = p.run()
    nvidia.dali.plugin.pytorch.feed_ndarray(pipe_out[0][0], Inputimages)
    print("inputimages type is",Inputimages.shape)
    return Inputimages

""" Network architecture. """
class mymodel(nn.Module):
    def __init__(self):
        super(mymodel, self).__init__()

        self.model1=nn.Sequential(
        nn.Conv2d(3, 32, 5, padding=2),
        nn.MaxPool2d(2),
        nn.Conv2d(32, 32, 5, padding=2),
        nn.MaxPool2d(2),
        nn.Conv2d(32, 64, 5, padding=2),
        nn.MaxPool2d(2),
        nn.Flatten(),  # 展平

        nn.Linear(64 * 4 * 4, 64),
        nn.Linear(64, 10),
        )

    def forward(self, x):  # input:32*32*3
        with torch.autograd.graph.saved_tensors_hooks(pack_hook,unpack_hook):
            x=self.model1(x)
        return x

net1=mymodel()
net1=net1.to(device)
loss_fn=nn.CrossEntropyLoss()
loss_fn=loss_fn.to(device)
optimizer=torch.optim.SGD(net1.parameters(),lr=0.1)

total_train_step=0
total_test_step=0
epoch=20

print(next(net1.parameters()).device)
total = sum([param.nelement() for param in net1.parameters()])
print("Number of parameter: %.2f M"  % (total/1024/1024))
print("Memory of parameter: %.2f M " % (cuda.memory_allocated()/1024/1024))

'''start training'''
totalbegin=time.time()
#gpu_tracker.track()
for i in range(epoch):
    print("--------------The {} training begins----------".format(i+1))

    running_loss=0
    running_correct=0

    begin=time.time()
    for data in train_dataloader:
        images,targets=data
        #print(images.device)
        images=images.to(device)
        targets=targets.to(device)

        outputs=net1(images)
        loss=loss_fn(outputs,targets)
        optimizer.zero_grad()
        loss.backward()
        optimizer.step()

        running_loss+=loss.item()
        running_correct += (outputs.argmax(1) == targets).sum()
        total_train_step+=1

        #if total_train_step%100==0:
        #    print("number of training:{},loss:{}".format(total_train_step,loss))

    end = time.time()
    print("spend time: ",(end-begin)/60)
    print("epoch:{}, loss:{}, accuracy:{}".format(i+1,running_loss/train_data_size,running_correct/train_data_size))

totalend=time.time()
print("total real runtime: ", (totalend - totalbegin) / 60)
#gpu_tracker.track()
print("gpu memory allocated: %2.f M " % (cuda.memory_allocated()/1024/1024))

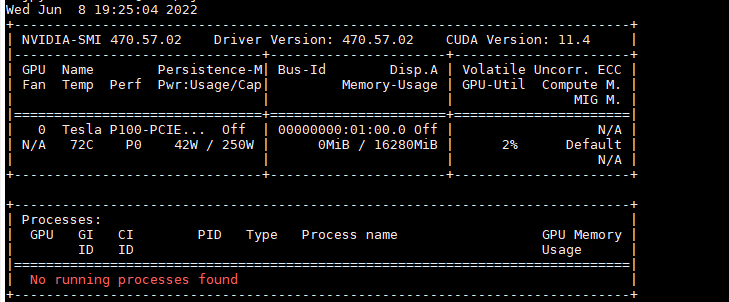
My GPU is Nvidia P100, and my Pytorch is 1.11.0+cu113. My Dali version is 1.14. 1654687519961
JanuszL commented 2 years ago

Hi @Weigaa,

The error tells that the Torch tensor and DALI output used in feed_ndarray types don't match. DALI returns int64 while torch.zeros creates float32. Your code should do something like:

    to_torch_type = {
        types.DALIDataType.FLOAT   : torch.float32,
        types.DALIDataType.FLOAT64 : torch.float64,
        types.DALIDataType.FLOAT16 : torch.float16,
        types.DALIDataType.UINT8   : torch.uint8,
        types.DALIDataType.INT8    : torch.int8,
        types.DALIDataType.INT16   : torch.int16,
        types.DALIDataType.INT32   : torch.int32,
        types.DALIDataType.INT64   : torch.int64
    }
    dali_tensor = pipe_out[0][0]
    torch_type = to_torch_type[dali_tensor.dtype]
    Inputimages = torch.zeros(file[1], dtype=torch_type).to(device)
    nvidia.dali.plugin.pytorch.feed_ndarray(dali_tensor, Inputimages)
Weigaa commented 2 years ago

@Januszl Thank you very much. After adding import nvidia.dali.types as types and your suggested code, my code can run fine. I noticed that the tensor I stored earlier are torch.cuda.FloatTensor and torch.cuda.LongTensor, can I directly use nvidia.dali.plugin.pytorch.feed_ndarray() change DALIDataType.INT64 to torch.cuda.LongTensor and DALIDataType.FLOAT to torch.cuda.FloatTensor ?

JanuszL commented 2 years ago

I think the best would be to use:

Inputimages = torch.empty(file[1], dtype=torch_type, device=device)

and keep types as proposed. According to https://pytorch.org/docs/stable/tensors.html torch.cuda.LongTensor is the TensorType while the torch.int64 is the dtype expected used to allocate an empty tensor.

Weigaa commented 2 years ago

@JanuszL I useInputimages = torch.empty(file[1], dtype=torch_type, device=device) to replaceInputimages = torch.zeros(file[1], dtype=torch_type).to(device). Unfortunately, Then, I used DALI and torch.load() to read the feature map from SSD to GPU respectively, and I found that DALI with GDS was much slower than torch.load() by the time.time() function to count the time, which seems abnormal, what is the reason for this?

The torch.save && torch.load code is:

import os
import time
import uuid
import inspect
import torch
import torch.nn as nn
import torch.nn.functional as F
import torchvision
from torch import cuda

from torch.utils.data import DataLoader
#from gpu_mem_track import MemTracker

device=torch.device('cuda:0')

train_data=torchvision.datasets.CIFAR10(root='./data',train=True,transform=torchvision.transforms.ToTensor(),download=True)
train_data_size=len(train_data)
#test_data_size=len(test_data)
print("train_data_size:{}".format(train_data_size))
train_dataloader=DataLoader(train_data,batch_size=2560)

'''hook'''
class SelfDeletingTempFile():
    def __init__(self):
        self.name=os.path.join("./",str(uuid.uuid4()))
    def __del__(self):
        os.remove(self.name)

def pack_hook(tensor):
    temp_file=SelfDeletingTempFile()
    begin = time.time()
    torch.save(tensor,temp_file.name)
    end = time.time()
    print(tensor.shape,"offload time is", end - begin)
    return temp_file

def unpack_hook(temp_file):
    begin = time.time()
    tensor = torch.load(temp_file.name)
    end = time.time()
    print(tensor.shape, "load time is", end - begin)
    return tensor

""" Network architecture. """
class mymodel(nn.Module):
    def __init__(self):
        super(mymodel, self).__init__()

        self.model1=nn.Sequential(
        nn.Conv2d(3, 32, 5, padding=2),
        nn.MaxPool2d(2),
        nn.Conv2d(32, 32, 5, padding=2),
        nn.MaxPool2d(2),
        nn.Conv2d(32, 64, 5, padding=2),
        nn.MaxPool2d(2),
        nn.Flatten(),  # 展平

        nn.Linear(64 * 4 * 4, 64),
        nn.Linear(64, 10),
        )

    def forward(self, x):  # input:32*32*3
        with torch.autograd.graph.saved_tensors_hooks(pack_hook,unpack_hook):
            x=self.model1(x)
        return x

net1=mymodel()
net1=net1.to(device)
loss_fn=nn.CrossEntropyLoss()
loss_fn=loss_fn.to(device)
optimizer=torch.optim.SGD(net1.parameters(),lr=0.1)

total_train_step=0
total_test_step=0
epoch=1

print(next(net1.parameters()).device)
total = sum([param.nelement() for param in net1.parameters()])
print("Number of parameter: %.2f M"  % (total/1024/1024))
print("Memory of parameter: %.2f M " % (cuda.memory_allocated()/1024/1024))

'''start training'''
totalbegin=time.time()
#gpu_tracker.track()
for i in range(epoch):
    print("--------------The {} training begins----------".format(i+1))
    running_loss=0
    running_correct=0
    begin=time.time()
    j = 0
    if (j > 0):
        break
    for data in train_dataloader:
        if (j > 0):
            break
        images,targets=data
        #print(images.device)
        images=images.to(device)
        targets=targets.to(device)

        outputs=net1(images)
        loss=loss_fn(outputs,targets)
        optimizer.zero_grad()
        loss.backward()
        optimizer.step()

        running_loss+=loss.item()
        running_correct += (outputs.argmax(1) == targets).sum()
        total_train_step+=1
        j += 1
        #if total_train_step%100==0:
        #    print("number of training:{},loss:{}".format(total_train_step,loss))

    end = time.time()
    print("spend time: ",(end-begin)/60)
    print("epoch:{}, loss:{}, accuracy:{}".format(i+1,running_loss/train_data_size,running_correct/train_data_size))

totalend=time.time()
print("total real runtime: ", (totalend - totalbegin) / 60)

The DALI code is:

import os
import time
import uuid
import inspect
import torch
import torch.nn as nn
import torch.nn.functional as F
import numpy as np
import torchvision
from torch import cuda
from nvidia.dali import pipeline_def, fn
import nvidia.dali.plugin.pytorch
from torch.utils.data import DataLoader
import nvidia.dali.types as types

device=torch.device('cuda:0')

#pynvml.nvmlInit()
#frame = inspect.currentframe()
#gpu_tracker = MemTracker(frame)

train_data=torchvision.datasets.CIFAR10(root='./data',train=True,transform=torchvision.transforms.ToTensor(),download=True)
#test_data=torchvision.datasets.CIFAR10(root='./data',train=False,transform=torchvision.transforms.ToTensor(),download=True)

train_data_size=len(train_data)
#test_data_size=len(test_data)
print("train_data_size:{}".format(train_data_size))
#print("test_data_size:{}".format(test_data_size))

train_dataloader=DataLoader(train_data,batch_size=2560)
#test_dataloader=DataLoader(test_data,batch_size=128)

'''hook'''
class SelfDeletingTempFile():
    def __init__(self):
        self.name=os.path.join("",str(uuid.uuid4()))
    def __del__(self):
        freefilename = self.name +'.npy'
        os.remove(freefilename)
        # print("successfully free " + freefilename)

@pipeline_def(batch_size=1, num_threads=8, device_id=0)
def pipe_gds(filename):
    data = fn.readers.numpy(device='gpu',file_root='.', files=filename)
    return data

def pack_hook(tensor):
    temp_file=SelfDeletingTempFile()
    begin = time.time()
    tensorshape = tensor.shape
    # print("save tensor type is", tensor.type(), "shape is",tensorshape )
    Inputnumpy = tensor.cpu().numpy()
    np.save(temp_file.name,Inputnumpy)
    file = [temp_file, tensorshape]
    end = time.time()
    print(tensor.shape,"offload time is", end - begin)
    return file

def unpack_hook(file):
    begin = time.time()
    begin2 = time.time()
    p = pipe_gds(filename=(file[0].name+'.npy'))
    p.build()
    pipe_out = p.run()
    end2 = time.time()
    to_torch_type = {
        types.DALIDataType.FLOAT: torch.float32,
        types.DALIDataType.FLOAT64: torch.float64,
        types.DALIDataType.FLOAT16: torch.float16,
        types.DALIDataType.UINT8: torch.uint8,
        types.DALIDataType.INT8: torch.int8,
        types.DALIDataType.INT16: torch.int16,
        types.DALIDataType.INT32: torch.int32,
        types.DALIDataType.INT64: torch.int64
    }
    dali_tensor = pipe_out[0][0]
    # print(dali_tensor.dtype)
    torch_type = to_torch_type[dali_tensor.dtype]
    Inputimages = torch.empty(file[1], dtype=torch_type).to(device)
    nvidia.dali.plugin.pytorch.feed_ndarray(dali_tensor, Inputimages)
    end = time.time()
    print(Inputimages.shape, "pure load time is", end2 - begin2)
    print(Inputimages.shape, "load time is", end - begin)
    # print("inputimages type is",Inputimages.shape)
    return Inputimages

""" Network architecture. """
class mymodel(nn.Module):
    def __init__(self):
        super(mymodel, self).__init__()

        self.model1=nn.Sequential(
        nn.Conv2d(3, 32, 5, padding=2),
        nn.MaxPool2d(2),
        nn.Conv2d(32, 32, 5, padding=2),
        nn.MaxPool2d(2),
        nn.Conv2d(32, 64, 5, padding=2),
        nn.MaxPool2d(2),
        nn.Flatten(),  # 展平

        nn.Linear(64 * 4 * 4, 64),
        nn.Linear(64, 10),
        )

    def forward(self, x):  # input:32*32*3
        with torch.autograd.graph.saved_tensors_hooks(pack_hook,unpack_hook):
            x=self.model1(x)
        return x

net1=mymodel()
net1=net1.to(device)
loss_fn=nn.CrossEntropyLoss()
loss_fn=loss_fn.to(device)
optimizer=torch.optim.SGD(net1.parameters(),lr=0.1)

total_train_step=0
total_test_step=0
epoch=1

print(next(net1.parameters()).device)
total = sum([param.nelement() for param in net1.parameters()])
print("Number of parameter: %.2f M"  % (total/1024/1024))
print("Memory of parameter: %.2f M " % (cuda.memory_allocated()/1024/1024))

'''start training'''
totalbegin=time.time()
#gpu_tracker.track()
for i in range(epoch):
    print("--------------The {} training begins----------".format(i+1))

    running_loss=0
    running_correct=0
    begin=time.time()
    j = 0
    if (j > 0):
        break
    for data in train_dataloader:
        if (j > 0):
            break
        images,targets=data
        #print(images.device)
        images=images.to(device)
        targets=targets.to(device)

        outputs=net1(images)
        loss=loss_fn(outputs,targets)
        optimizer.zero_grad()
        loss.backward()
        optimizer.step()

        running_loss+=loss.item()
        running_correct += (outputs.argmax(1) == targets).sum()
        total_train_step+=1
        j += 1

        #if total_train_step%100==0:
        #    print("number of training:{},loss:{}".format(total_train_step,loss))

    end = time.time()
    print("spend time: ",(end-begin)/60)
    print("epoch:{}, loss:{}, accuracy:{}".format(i+1,running_loss/train_data_size,running_correct/train_data_size))

totalend=time.time()
print("total real runtime: ", (totalend - totalbegin) / 60)
#gpu_tracker.track()
print("gpu memory allocated: %2.f M " % (cuda.memory_allocated()/1024/1024))

We noticed that p.build() code occupied almost 97% load time via DALI, does it mean that DALI has a serious pipeline construction overhead (start-up overhead) and is there a way we can avoid this?

JanuszL commented 2 years ago

Hi @Weigaa,

DALI and GDS that DALI uses inside the numpy reader for the GPU have noticeable construction time overhead. DALI is not optimized for frequent pipeline recreation but the fast execution once the flow is defined. If your goal is to load the files from the drive to the GPU memory without any processing DALI maybe not be the best choice. You may consider trying out https://github.com/rapidsai/kvikio just for that.

Weigaa commented 2 years ago

Hi@JanuszL We tried using kvikio for data transfer from SSD to GPU and it seems that kvikio.Cufile() also has a large build overhead in write mode ("w"). In read mode ("r") there is no build overhead, but it seems to have much lower read bandwidth than DALI (even with the DALI pipeline batchsize set to 1). After removing the building overhead, my test gds read from SSD to GPU(3080Ti) results are shown in the table below, are the results of this experiment accurate? <html xmlns:v="urn:schemas-microsoft-com:vml" xmlns:o="urn:schemas-microsoft-com:office:office" xmlns:x="urn:schemas-microsoft-com:office:excel" xmlns="http://www.w3.org/TR/REC-html40">

Block size(MB) | Kvikio_Cufile Bandwidth(MB/s) | DALI Bandwidth (MB/s) pipeline=1 | DALI Bandwidth(MB/s) pipeline=best -- | -- | -- | -- 1568 | 1590.909091 | 7720.33481 | 8371.596369 784 | 1549.407115 | 7619.047619 | 8276.153278 392 | 1584.478577 | 6555.183946 | 8202.552835 196 | 1542.09284 | 4708.143166 | 8112.582781 98 | 1517.027864 | 3110.12377 | 8536.585366 49 | 1585.760518 | 1749.375223 | 8044.65605 24.5 | 1531.25 | 989.4991922 | 8288.227334 12.25 | 1346.153846 | 535.1681957 | 8448.275862 6.125 | 1177.884615 | 510.8423686 | 7862.644416 3.0625 | 995.2876178 | 279.9360146 | 8019.114952

JanuszL commented 2 years ago

Hi @Weigaa,

Regarding the measurements, I would check profiles using Nsight Systems profiler to make sure that you measure not only the time taken by the issue of the copy on the CPU but the whole transfer till the end. If you could share the profiles it would make the comparison much easier.

Weigaa commented 2 years ago

@JanuszL We are not currently using the Nsight System profiler and it will take us some time to learn and try out the tool, if you could help us with testing then I would be very grateful. To ensure that our time statistics are accurate, we add the torch.cuda.synchronize() statement before using the time.time() function. The code we used to test DALI you can find in the previous communication, below is the code we used to test kvikio for your reference.

device=torch.device('cuda:0')
testmodelbsz = 512
N = 30
average_save_tensor = 0
average_save_numpy = 0
#
f = kvikio.CuFile('Inputnumpy.npy', "w")
#使用torch.save()写张量到SSD
for i in range(1):
    Inputimages = torch.randn(testmodelbsz, 256, 56, 56).cuda()
    # Inputimages = torch.randn(256, 56, 56)
    # path = 'Inputtensor' + str(i) + '.pt'
    # path2 = 'Inputnumpy' + str(i) + '.npy'
    Inputcupy = cupy.asarray(Inputimages)
    torch.cuda.synchronize()
    begin = time.time()
    # f = kvikio.CuFile(path2, "w")
    f.write(Inputcupy)
    # f.close()
    torch.cuda.synchronize()
    end = time.time()
    time2 = end - begin
    if i > 0:
        average_save_numpy += time2
    # os.remove(path2)
    print("numpysave spendtime is", time2)
f.close()
print( "average cupysave spendtime is" , average_save_numpy / (N - 1))

# #使用kvikio读数据时间
averageloadtime = 0
f = kvikio.CuFile('Inputnumpy.npy', "r")
#CPU到GPU传输测试
cupyimages = cupy.asarray(torch.empty(testmodelbsz, 256, 56, 56))
for i in range(N):
    torch.cuda.synchronize()
    # path3 = 'Inputcupy' + str(i)
    begin = time.time()
    Inputimages = cupy.empty_like(cupyimages)
    # f = kvikio.CuFile(path3, "r")
    # Read whole array from file
    f.read(Inputimages)
    Inputtensor = torch.as_tensor(Inputimages, device = device)
    torch.cuda.synchronize()
    end = time.time()
    if i > 0:
        averageloadtime += end - begin
    print("load time is", end - begin)
    # os.remove(path3)
print("average load time is", averageloadtime/(N -1))
os.remove('Inputnumpy.npy')
azrael417 commented 2 years ago

Hello @Weigaa,

thanks for your insights. Before trying to dig deeper into this issue, did you make sure that your drive is GDS compatible? Each gds installation comes with a checker tool, called gdschecker. If you call gdschecker -P it should tell you what the GDS supported partitions are. Can you please give me the output of that? Also, what kind of storage are you reading from? Is it remote storage (e.g. GPFS or LUSTRE) or local (NVME)? If it is NVME, are you using a software RAID?

For more info, please check the GDS configuration Guide.

Concerning DALI and GDS: I am unfamiliar with the hooks you are using. Are those hooks executed on every fwd pass? If yes, then it seems to rebuild the pipeline at each step which is not recommended. In terms of GDS, this would open and destroy the GDS driver at every single iteration and adds additional overhead to the overall DALI construction overhead.

Please let me know what you think

Best and thanks Thorsten

Weigaa commented 2 years ago

Hi@azrael417 @JanuszL Thank you very much. For your first question, the output of gdschecker -P are: 1655113066258 I'm not sure if this output means that the system is compatible. I'm not sure if this is due to my GPU version not supporting GDS, or not using a Mellanox Connect5 or newer NIC? Could you tell me something useful about that? And my storage read from local NVME SSD without RAID, the SSD information is: 09:00.0 Non-Volatile memory controller: Intel Corporation Optane SSD 900P Series I use mount /dev/nvme0n1 /mnt/optane/ to mount the SSD to my directory.

For your second question, I rewrote the code without using hook to test DALI, you could ignore the code above and just focus on the following: Step 1: create some test files:

import torch
from nvidia.dali import pipeline_def, fn
import nvidia.dali.plugin.pytorch
import os
import time
import numpy as np
device=torch.device('cuda:0')
batch_size = 32 # to be used in pipelines
dali_extra_dir = os.environ['DALI_EXTRA_PATH']
# data_dir_2d = os.path.join(dali_extra_dir, 'db', '3D', 'MRI', 'Knee', 'npy_2d_slices', 'STU00001')
# data_dir_3d = os.path.join(dali_extra_dir, 'db', '3D', 'MRI', 'Knee', 'npy_3d', 'STU00001')
# data_dir = os.path.join(data_dir_2d, 'SER00001')
# # Listing all *.npy files in data_dir
data_dir = '.'
files = sorted([f for f in os.listdir(data_dir) if '.npy' in f])
testmodelbsz = 32
# files  = files[0:5]
N = 10
for i in range(N):
    # Inputimages = torch.randn(testmodelbsz, 256, 56, 56).cuda()
    Inputimages = torch.randn(testmodelbsz, 256, 56, 56)
    path2 = 'Inputnumpy' + str(i) + '.npy'
    # save by numpy
    torch.cuda.synchronize()
    begin = time.time()
    Inputnumpy = Inputimages.cpu().numpy()
    np.save(path2, Inputnumpy)
    torch.cuda.synchronize()
    end = time.time()
    time2 = end - begin
    average_save_numpy += time2
    print("numpysave spendtime is", time2)

Step 2: use DALI pipeline load data:

@pipeline_def(batch_size=batch_size, num_threads=8, device_id=0)
def pipe_gds():
    data = fn.readers.numpy(device='gpu', file_root=data_dir, files=files)
    return data
#DALI_Batch Load
average_transfer_pipeline_numpy = 0
p = pipe_gds()
p.build()
for i in range(N):
    torch.cuda.synchronize()
    begin = time.time()
    pipe_out= p.run()
    torch.cuda.synchronize()
    end = time.time()
    time1 = end - begin
    print("numpyload pipeline spendtime is", time1)
    print(len(pipe_out[0]))
    if i > 1:
        average_transfer_pipeline_numpy += time1
print("average numpyload pipeline spendtime is", average_transfer_pipeline_numpy / ((N -2) * batch_size) )

and we use the following pipeline to test no pipeline DALI:

@pipeline_def(batch_size=1, num_threads=8, device_id=0)
def pipe_gds(filename):
    data = fn.readers.numpy(device='gpu', file_root=data_dir, files=filename)
    return data

The calculated times turned out to be consistent with our previous feedback.

Last for the GDS, we often save different Cuda tensors with a different name, so open and destroy the GDS by f = kvikio.CuFile(path2, "w") and f.close() is necessary, because each iteration the path2 is different. We apologise for the previous error in providing GDS to "write" code instead of "read" code. In order to achieve a fair comparison, I modified some code for kvikio.cufile(), and retested the results, the codes are as follows:

device=torch.device('cuda:0')
testmodelbsz = 512
N = 30
average_save_tensor = 0
average_save_numpy = 0
#
f = kvikio.CuFile('Inputnumpy.npy', "w")
#使用torch.save()写张量到SSD
for i in range(1):
    Inputimages = torch.randn(testmodelbsz, 256, 56, 56).cuda()
    # Inputimages = torch.randn(256, 56, 56)
    # path = 'Inputtensor' + str(i) + '.pt'
    # path2 = 'Inputnumpy' + str(i) + '.npy'
    Inputcupy = cupy.asarray(Inputimages)
    torch.cuda.synchronize()
    begin = time.time()
    # f = kvikio.CuFile(path2, "w")
    f.write(Inputcupy)
    # f.close()
    torch.cuda.synchronize()
    end = time.time()
    time2 = end - begin
    if i > 0:
        average_save_numpy += time2
    # os.remove(path2)
    print("numpysave spendtime is", time2)
f.close()
print( "average cupysave spendtime is" , average_save_numpy / (N - 1))

# #使用kvikio读数据时间
averageloadtime = 0
f = kvikio.CuFile('Inputnumpy.npy', "r")
#CPU到GPU传输测试
cupyimages = cupy.asarray(torch.empty(testmodelbsz, 256, 56, 56))
for i in range(N):
    torch.cuda.synchronize()
    # path3 = 'Inputcupy' + str(i)
    begin = time.time()
    Inputimages = cupy.empty_like(cupyimages)
    # f = kvikio.CuFile(path3, "r")
    # Read whole array from file
    f.read(Inputimages)
    Inputtensor = torch.as_tensor(Inputimages, device = device)
    torch.cuda.synchronize()
    end = time.time()
    if i > 0:
        averageloadtime += end - begin
    print("load time is", end - begin)
    # os.remove(path3)
print("average load time is", averageloadtime/(N -1))
os.remove('Inputnumpy.npy')

The kvikio_Cufile read bandwidth is: <html xmlns:v="urn:schemas-microsoft-com:vml" xmlns:o="urn:schemas-microsoft-com:office:office" xmlns:x="urn:schemas-microsoft-com:office:excel" xmlns="http://www.w3.org/TR/REC-html40">

Block size(MB) | Kvikio_Cufile Read Bandwidth(MB/s) -- | -- 1568 | 1940.209859 784 | 1888.701518 392 | 1930.083703 196 | 1861.596034 98 | 1901.804774 49 | 1772.151899 24.5 | 1788.321168 12.25 | 157.6373697 6.125 | 1447.306238 3.0625 | 1126.747609

azrael417 commented 2 years ago

Hello @Weigaa ,

A few things to mention here:

1) it seems that your installation does not support GDS. When you installed CUDA on the system, did you also install the GDS drivers? In the meantime, I will crosscheck with the GDS product team if Intel Optane memory is supported by GDS.

2) For general DL workloads, I expect that a custom reader using kvikio will deliver worse performance if it is not properly called in a subprocess, since basically all the IO is serialized with the training. If you are using it inside a pytorch DataLoader, be careful that the subprocess needs to be either spawned or forkserver forked because otherwise the CUDA context will get corrupted. In general, DALI avoids this. In any case, you can experiment with different number of threads. It is not documented but can be set by a module function. Also, kvikio supports async IO. Please check this part, I think it is not documented either. But basically it allows you to fire off IO on a batch and then wait for completion.

3) So better let's focus on DALI with GDS and without GDS fully serialized, that means without any NN attached to it. What performance do you get when you use the exact same pipeline, once with GDS (i.e. fn.readers.numpy device is gpu) vs the POSIX based pipeline (device is cpu).

4) While employing 8 threads sounds reasonable, please play around with the numbers of threads. Also, please state register_buffers = True and cache_header_information=True in the reader for best GDS performance.

Best Thorsten

Weigaa commented 2 years ago

Hi @azrael417 , Thanks again, Thorsten. We still have some questions that we would like to get your help with.

  1. We do have GDS installed, we use gdscheckand get a "Platform Verification succeeded", but it seems we are running in "compatibility mode" and not in real GDS. Could you please help us to confirm ① whether the 3080TI GPU supports GPU Direct storage and ② whether a mellanox Connect5 or higher smart network card (NIC) must be installed?
  2. Kvikio indeed has Non-blocking read API, but I can't find the async write API. I will try the kvikio Non-blocking read API later. I agree that DALI can help me solve serial I/O problems and that is exactly why I chose it. Although I use it in the training process and not just when reading input data. A rule of thumb is that I/O speeds are faster when the number of threads is the same as the number of real processor cores on the host, and I will try different numbers of threads to enrich my results.
  3. We will add and report on the results of the tests using device='cpu' as soon as possible.
  4. Our Intel(R) Xeon(R) CPU E5-2680 v4 server has 28 physical cores and 56 logical cores, and we increased the test thread number range from 2 to 128 in powers of 2 as well as testing 28 and 56 separately. And we also add register_buffers = True and cache_header_information=True to the numpy reader. In order to make our experiment more meaningful, I hope to get a response to question 1 as soon as possible, thank you very much.

Best Jia Wei

Weigaa commented 2 years ago

@azrael417 @JanuszL We have done more experiments on DALI, comparing device='cpu' and decive='gpu' under the same experimental environment and pipeline settings, and the results are shown in the table below. <html xmlns:v="urn:schemas-microsoft-com:vml" xmlns:o="urn:schemas-microsoft-com:office:office" xmlns:x="urn:schemas-microsoft-com:office:excel" xmlns="http://www.w3.org/TR/REC-html40">

In addition, we re-checked the GDS development documentation and we found that GDS does not seem to support the 3080TI GPU, so we used the P100 for the following test experiments with different threads. Unfortunately, even though we reinstalled the CUDA and GDS drivers on the P100, we found that all devices, including NVME, were in the "unsupported" state via gdscheck. Therefore, the following experiments are still conducted in gds-compatible mode. Block size(MB) | Kvikio_Cufile Bandwidth(MB/s) | DALI Bandwidth (MB/s) pipeline=1 | DALI Bandwidth(MB/s) pipeline=best | DALI Bandwidth CPU(MB/s) pipeline=1 | DALI Bandwidth CPU(MB/s) pipeline=best -- | -- | -- | -- | -- | -- 1568 | 1940.209859 | 7720.33481 | 8371.596369 | 3438.596491 | 5915.864931 784 | 1888.701518 | 7619.047619 | 8276.153278 | 3684.210526 | 7468.08916 392 | 1930.083703 | 6555.183946 | 8202.552835 | 4288.840263 | 7013.777062 196 | 1861.596034 | 4708.143166 | 8112.582781 | 4458.598726 | 7486.631016 98 | 1901.804774 | 3110.12377 | 8536.585366 | 4322.893692 | 6712.328767 49 | 1772.151899 | 1749.375223 | 8044.65605 | 4313.380282 | 7059.501513 24.5 | 1788.321168 | 989.4991922 | 8288.227334 | 2793.296089 | 6193.124368 12.25 | 157.6373697 | 535.1681957 | 8448.275862 | 3134.595701 | 6702.412869 6.125 | 1447.306238 | 510.8423686 | 7862.644416 | 4316.420014 | 7036.1861 3.0625 | 1126.747609 | 279.9360146 | 8019.114952 | 3835.796593 | 6564.844587

In addition, we re-checked the GDS development documentation and we found that GDS does not seem to support the 3080TI GPU, so we used the P100 for the following test experiments with different threads. Unfortunately, even though we reinstalled the CUDA and GDS drivers on the P100 GPU, we found that all devices, including NVME, were in the "unsupported" state via gdscheck. Therefore, the following experiments are still conducted in gds-compatible mode. We have reported our installation problems here https://github.com/NVIDIA/DALI/issues/4009.

The results of the different threads are shown below. "with optimization" means thatregister_buffers = True and cache_header_information = Truehave been added to the numpy reader, while the opposite is true. "no optimization" does not add the above statements. The experimental results show that the difference between the two is not significant. When the data blocks are small, it seems to be more efficient to use a smaller number of threads.

<html xmlns:v="urn:schemas-microsoft-com:vml" xmlns:o="urn:schemas-microsoft-com:office:office" xmlns:x="urn:schemas-microsoft-com:office:excel" xmlns="http://www.w3.org/TR/REC-html40">

num_threads | datablock_size | Batchsize | Bandwidth (no optimization) | Bandwidth (with optimization) -- | -- | -- | -- | -- 1 | 12.25 | 256 | 5197.284684 | 5223.880597 2 | 12.25 | 256 | 8832.011536 | 8944.21729 4 | 12.25 | 256 | 9960.159363 | 9974.757756 8 | 12.25 | 256 | 8897.443347 | 9016.634771 16 | 12.25 | 256 | 8433.73494 | 8434.315616 32 | 12.25 | 256 | 7949.899409 | 7966.443389 64 | 12.25 | 256 | 7642.874969 | 7699.560025 128 | 12.25 | 256 | 7117.789244 | 6995.203289 28 | 12.25 | 256 | 8115.269957 | 8335.601524 56 | 12.25 | 256 | 7608.695652 | 7660.08004 256 | 12.25 | 256 | 6334.022751 | 6963.788301

We've done all we can, but the biggest challenge at the moment seems to be that we don't know how to tune our hardware and software configurations to get our NVMe SSD and P100 GPU to support GDS?

azrael417 commented 2 years ago

Hello Weigaa,

sorry for the late reply. I am trying to figure that out with the GDS developers. So good news is, P100 is supported. Therefore, the reason why you are seeing this unsupported messages is a different one.

There are several issues here, let's go step by step. Let's debug the setup issue at the other ticket, 4009 and let's keep this to the DALI/GDS interaction itself. So, the perf you shared above for DALI GPU and CPU does not look so. bad, does it? What is the peak bandwidth of your drive you used for that test? 8GB/sec looks reasonable to me. Is that single GPU or aggregate?

It seems that the GDS version performs better than the POSIX one, even in compat mode, do I read that correctly? So that is good news. It likely has to do with the fact that the parallelization in the GDS code branch is a bit more aggressive. Therefore, perf speedups can also be due to the different parallelization scheme. In any case, it would be good to know what bandwidth you expect from the drive per employed GPU.

Best regards Thorsten

Weigaa commented 2 years ago

Hi @azrael417 , Thank you for your reply. We found that the reason for the NVMe unsupported error may be due to the linux kernel version. We found that the GDS development documentation requires a linux kernel of 5.4.x. Therefore, we previously used 5.4.120 but it appeared unsupported. However, when we try to use the linux 5.4.70 kernel, as shown in Figure 1 below, NVMe seems to be supported, but our Mellanox Peerdirect is still disable, causing an error when we run our program after we turn off compatibility mode, with the error result shown in Figure 2. We would be grateful if you could help us to resolve this issue or ask the GDS team for help. res1 Fig.1 res2 Fig.2

Let's go back to DALI itself, our PCIe drives (NVMe SSD and P100) are mounted on PCIe 3.0 × 16 with a peak bandwidth of 16GB/s and we are only using one GPU.

Yes, transferring data to the GPU using DALI.GDS can sometimes be faster than transferring to the CPU using DALI.CPU, even if we are using GDS-compatible mode. However, in GDS compatibility mode we have higher CPU utilisation (about the same as POSIX reads to the CPU) and lower CPU and DRAM utilisation is what we want to use GDS for, which we don't do in compatibility mode. We would like our GPU drive to reach close to the full bandwidth of PCIe 3.0 x16 (16GB/s) and CPU utilisation should be low as GPUDirect-Fig-7 said.

Look forward to your reply!

Best regards, Jia Wei

Weigaa commented 2 years ago

Hi, @azrael417 After communicating with the GDS engineer via email, our GDS environment now appears to be working properly. This is shown in the figure below. 1656561501473 However, when we turned off compatibility mode and tested our program, the previous error reappeared.

(wjpytorch) root@nuosen:/mnt/optane/wjtest# python testGDS.py
Traceback (most recent call last):
  File "/mnt/optane/wjtest/testGDS.py", line 186, in <module>
    pipe_out= p.run()
  File "/root/anaconda3/envs/wjpytorch/lib/python3.9/site-packages/nvidia/dali/pipeline.py", line 980, in run
    return self.outputs()
  File "/root/anaconda3/envs/wjpytorch/lib/python3.9/site-packages/nvidia/dali/pipeline.py", line 879, in outputs
    return self._outputs()
  File "/root/anaconda3/envs/wjpytorch/lib/python3.9/site-packages/nvidia/dali/pipeline.py", line 963, in _outputs
    return self._pipe.Outputs()
RuntimeError: Critical error in pipeline:
Error when executing GPU operator readers__Numpy encountered:
Error in thread 0: [/opt/dali/dali/util/std_cufile.cc:73] CUFile import failed: ./Inputnumpy.npy. GPUDirect Storage not supported on current file.
Stacktrace (9 entries):
[frame 0]: /root/anaconda3/envs/wjpytorch/lib/python3.9/site-packages/nvidia/dali/libdali.so(+0x83f5f) [0x7f9be77a2f5f]
[frame 1]: /root/anaconda3/envs/wjpytorch/lib/python3.9/site-packages/nvidia/dali/libdali.so(+0x1b44ef) [0x7f9be78d34ef]
[frame 2]: /root/anaconda3/envs/wjpytorch/lib/python3.9/site-packages/nvidia/dali/libdali.so(+0x1b4f87) [0x7f9be78d3f87]
[frame 3]: /root/anaconda3/envs/wjpytorch/lib/python3.9/site-packages/nvidia/dali/libdali.so(dali::CUFileStream::Open(std::string const&, bool, bool)+0xbf) [0x7f9be78d29ef]
[frame 4]: /root/anaconda3/envs/wjpytorch/lib/python3.9/site-packages/nvidia/dali/libdali_operators.so(+0x2ddc749) [0x7f9bca232749]
[frame 5]: /root/anaconda3/envs/wjpytorch/lib/python3.9/site-packages/nvidia/dali/libdali.so(dali::ThreadPool::ThreadMain(int, int, bool)+0x1fe) [0x7f9be787c9de]
[frame 6]: /root/anaconda3/envs/wjpytorch/lib/python3.9/site-packages/nvidia/dali/libdali.so(+0x721d9f) [0x7f9be7e40d9f]
[frame 7]: /lib/x86_64-linux-gnu/libpthread.so.0(+0x76db) [0x7f9cbfaf06db]
[frame 8]: /lib/x86_64-linux-gnu/libc.so.6(clone+0x3f) [0x7f9cbf81961f]

When we turn on compatibility mode, the program runs, but it doesn't run faster than before, it doesn't use less CPU and memory, and GDS doesn't seem to take effect. I would like to know if this is a DALI problem or a GDS problem? Best regards, Jia Wei

azrael417 commented 2 years ago

Hello @Weigaa,

so this is a GDS issue: inside DALI, I am printing the CUFILE error I receive. It says:

Error in thread 0: [/opt/dali/dali/util/std_cufile.cc:73] CUFile import failed: ./Inputnumpy.npy. GPUDirect Storage not supported on current file.

So that means it tries to load from unsupported storage. Now I am wondering why it thinks that. The files are all on the supported NVME drive, right? What I would do to check is to run gdsio in write mode on the drive in question and see what you get. For examples check the documentation page. It looks like your system config is in some kind of weird spot in terms of compatibility which wasn't tested I believe (you mentioned that your previous kernel should have been supported but it wasn't). GDSIO will tell you at least if DALI-GDS is supposed to work.

Best Thorsten

azrael417 commented 2 years ago

Please make sure that you point it to an empty directory on the NVME drive. I recommend to create some dummy files there or let gdsio write some files there which you then read back in with gdsio as well. If that works, then we take it from there. Are you running DALI inside the container? If yes, it might make sense to use strace to check which libcufile DALI dlopens.

Weigaa commented 2 years ago

Hi, @azrael417 The files are all on the Intel Optane SSD which I mentioned before, I think it is a supported NVME drive. I run gdsio to read file by GDS(Turn off compatibility mode), and the same error occurs:

(base) root@nuosen:/usr/local/cuda-11.7/gds/tools# ./gdsio -f /mnt/optane/test10G -d 0 -n 0 -w 1 -s 10G -x 0 -I 1 -T 10 -i 4096K
file register error: GPUDirect Storage not supported on current file filename :/mnt/optane/test10G

I am not running DALI on containers but on bare metal.

I checked the documentation for this error and it seems to be caused by the file system or the NVMe device that I mounted. However, I think they are both suitable, so I am very confused about the results that I got.

Weigaa commented 2 years ago

In addition, we found a very strange phenomenon. Even with the error message, when we use gdsio to do a "write" operation, we still find that a file of the specified size is successfully written. Even writing a file by gdsio(GDS mode) to a folder mounted on hdd can be done successfully although with the "file register error".

Weigaa commented 2 years ago

@azrael417 We discovered the cause of our error, we had previously mounted our optane SSD using the following statement. mount /dev/nvme0n1 /mnt/optane Later, we modified the mount to the following statement. mount -t ext4 -o data=ordered /dev/nvme0n1 /mnt/optane We specified the data file mode for ext4, and now the shutdown compatibility mode program can be executed as well. This is something I didn't find in any of the GDS user manuals, and I would suggest that subsequent GDS teams could add this to the installation manual (as it did take us a lot of time to find, and hopefully future researchers can avoid it). However, we found that it seems to be slower in DALI with GDS than in GDS compatibility mode with a larger batchsize. We will repeat our previous experiments in GDS non-compatible mode to verify this.

Weigaa commented 2 years ago

Hi, @azrael417 The results of our tests in real GDS are shown in the table below. <html xmlns:v="urn:schemas-microsoft-com:vml" xmlns:o="urn:schemas-microsoft-com:office:office" xmlns:x="urn:schemas-microsoft-com:office:excel" xmlns="http://www.w3.org/TR/REC-html40">

Block size(MB) | Kvikio_Cufile Bandwidth(MB/s) | DALI Bandwidth (MB/s) pipeline=1 | DALI Bandwidth(MB/s) pipeline=best | DALI Bandwidth CPU(MB/s) pipeline=1 | DALI Bandwidth CPU(MB/s) pipeline=best | DALI Bandwidth (MB/s)  no_comp pipeline=1 | DALI Bandwidth(MB/s)  no_comp pipeline=best -- | -- | -- | -- | -- | -- | -- | -- 1568 | 1940.209859 | 7720.33481 | 8371.596369 | 3438.596491 | 5915.864931 | 2538.396896 | 2541.87535 784 | 1888.701518 | 7619.047619 | 8276.153278 | 3684.210526 | 7468.08916 | 2547.59873 | 2555.52564 392 | 1930.083703 | 6555.183946 | 8202.552835 | 4288.840263 | 7013.777062 | 2544.852704 | 2559.371544 196 | 1861.596034 | 4708.143166 | 8112.582781 | 4458.598726 | 7486.631016 | 2523.756792 | 2560.137098 98 | 1901.804774 | 3110.12377 | 8536.585366 | 4322.893692 | 6712.328767 | 2486.047692 | 2558.593087 49 | 1772.151899 | 1749.375223 | 8044.65605 | 4313.380282 | 7059.501513 | 2405.498282 | 2532.493441 24.5 | 1788.321168 | 989.4991922 | 8288.227334 | 2793.296089 | 6193.124368 | 2281.829189 | 2521.473693 12.25 | 157.6373697 | 535.1681957 | 8448.275862 | 3134.595701 | 6702.412869 | 2114.402099 | 2529.805236 6.125 | 1447.306238 | 510.8423686 | 7862.644416 | 4316.420014 | 7036.1861 | 1707.983603 | 2490.242316 3.0625 | 1126.747609 | 279.9360146 | 8019.114952 | 3835.796593 | 6564.844587 | 1581.004202 | 2417.508683

num_threads datablock_size Batchsize no_comp  Bandwidth (no optimization) no_comp Bandwidth (with optimization)
1 12.25 256 1656.591883 1886.066205
2 12.25 256 1948.930077 2244.206284
4 12.25 256 1981.928052 2269.443106
8 12.25 256 1989.5407 2260.314414
16 12.25 256 1997.456301 2264.409035
32 12.25 256 2024.458767 2261.040337
64 12.25 256 2089.195873 2246.346249
128 12.25 256 2107.889529 2237.900721
28 12.25 256 2139.868813 2222.746407
56 12.25 256 2153.6076 2206.51146
256 12.25 256 2167.903699 2186.890795

The non-compatible mode of GDS has much lower IO bandwidth than the compatible mode, and neither increasing the number of DALI pipelines nor increasing the number of threads can increase the IO bandwidth.

We found by reviewing the GDS technical documentation that POSIX pread and pwrite are used in GDS compatibility mode. We also found that the highest GPU utilization during data IO in GDS compatibility mode can reach 100%, however, in non-compatibility mode, this value is 1-2%, and I think the results we got from our tests may be related to it.

We would like to know if DALI is not optimized for parallelization of real GDS? Why can't it achieve the same bandwidth as in compatibility mode? Look forward to your reply.

Yours, Jia Wei

azrael417 commented 2 years ago

Hello @Weigaa,

I apologize for the silence but I was/am on vacation till July 15. What I read from the table is that GDS compat mode is faster than GDS native, is that correct?

The DALI backend for compat vs non compat is the same. The DALI backend for the CPU based numpy loader has different threading, so there is no surprise to me that the GDS one can utilize threads better especially for larger block sizes (the CPU version does inter sample parallelization, the GDS one inter as well as intra sample parallelization). When it comes to native vs compat mode, this is a bit more complicated. Is that pipeline running in IO only mode still or are you running training besides it?

Best Thorsten

Weigaa commented 2 years ago

Hi @azrael417 , Thank you. Have a great vacation! When running GDS compatibility mode, we uninstalled nvidia_fs with the following command(modprobe -r nvidia_fs) to force GDS to use the POSIX interface of linux, and NVME shows "unsupported". When running native mode, we introduced nvidia_fs normally to make GDS work in non-compatible mode. Our experimental results are achieved with the above settings. This means that when GDS uses Linux's POSIX interface, it can parallelize very well. When GDS uses Cufile() in true, non-compatible mode(native mode), even an increase in pipeline and threads seems to have some effect on I/O performance, but IO performance is still significantly inferior to compatibility mode. This means that the compatibility mode used to enable non-GDS-enabled devices to use the cufile() interface transfers faster than the true GDS mode. This result looks very strange. And I ran that pipeline in IO only mode without running any other training.

azrael417 commented 2 years ago

Hello @Weigaa,

What you did sounds correct. In more recent GDS versions, there is a simpler method to enforce compat mode but your solution works. I think this is an issue for the GDS engineers, I will point them to this thread.

Another thing we need to watch out for is data caching. How big is your file cache and how big is the overall dataset. It is artificial afaics, which means it is likely small, is that correct? So this means, it might get cached into DRAM and then POSIX can read it from there and will be faster than GDS. I am not 100% certain if compat mode uses O_DIRECT (in which case it won't get cached), but I am certain that data in native mode does not get cached. We should run a test to see if that could be an issue. The following two methods should work:

1) create a big enough dataset so that it does not fit into file cache. This could be multiple TB in some cases, I do not recommend this solution. 2) Flush the cache after writing the files. What I would do is: a) create all the artificial files, say a total of 2 GB or so. After creating those files, they likely reside in file cache. b) build the pipeline and run a few warmup iterations, stuff will be loaded from file cache but all buffers etc are created which is what we want. c) flush the file system caches echo 3 > /proc/sys/vm/drop_caches. free -m should show you that the file cache is (almost) empty. Run the free command before and after flushing to verify that indeed something changed. d) run a single iteration over the full dataset and time it. Compute average bandwidth in GB/s as well as samples / sec from that. Do not run more than one iteration or otherwise the data could come from file cache in POSIX case and from disk in GDS case (I need to verify the former still). Do this exercise for native and compat mode.

Please let me know what you get.

Best Thorsten

KiranModukuri commented 2 years ago

Hi @Weigaa,

In addition to caching of data in sys memory, GDS p2p can be slower on some platforms when the GPU and storage device are not under PCIe switch. please see the GDS design guide for recommended config and determine if the storage device is close to the GPU https://docs.nvidia.com/gpudirect-storage/configuration-guide/index.html#benchmarking-gds

If your organization has Nvidia enterprise support, please file a NVBug.

Weigaa commented 2 years ago

Hi, @KiranModukuri Thank u. Since I was only using a PCIe switch, a GPU card and an NVMe device, I made sure they were under the same PCIe switch. The output is shown below. And sorry I'm not sure what you mean about filing an NVBug(for what)? Now I focus on the caching problem.

(base) root@nuosen:~# lspci -tv | egrep -i "nvidia | optane"
             +-02.0-[02-05]----00.0-[03-05]--+-08.0-[04]----00.0  NVIDIA Corporation GP100GL [Tesla P100 PCIe 16GB]
             |                               \-10.0-[09]----00.0  Intel Corporation Optane SSD 900P Series
azrael417 commented 2 years ago

Hello @Weigaa,

can you please hand us a simple reproducer for this problem. I lost track of what the latest code is, it would be good if you can just drop a Python script which we can look at.

Best and thanks Thorsten

Weigaa commented 2 years ago

Hi @azrael417 , No problem! You may need to have a Pytorch (v1.11.0 is best) to run the script, we write some files firstly, then use DALI to read them. You do not need to modify the code whenever running in compatibility mode or native (p2p) mode. P.S. Comments are used to read and write files in other ways and you can choose to ignore them. Code:

import torch
from nvidia.dali import pipeline_def, fn
import nvidia.dali.plugin.pytorch
import os
import time
# misc python stuff
import numpy as np
from glob import glob
import shutil
import tempfile
import cupy
import kvikio
# visualization
from PIL import Image

# def plot_batch(np_arrays, nsamples=None):
#     if nsamples is None:
#         nsamples = len(np_arrays)
#     fig, axvec = plt.subplots(nrows=1, ncols=nsamples, figsize=(10, 10 * nsamples))
#     for i in range(nsamples):
#         ax = axvec[i]
#         ax.tick_params(left=False, bottom=False, labelleft=False, labelbottom=False)
#         ax.imshow(Image.fromarray(np_arrays[i]))
#     plt.tight_layout()
device=torch.device('cuda:0')
batch_size = 1024 # to be used in pipelines
dali_extra_dir = os.environ['DALI_EXTRA_PATH']
# data_dir_2d = os.path.join(dali_extra_dir, 'db', '3D', 'MRI', 'Knee', 'npy_2d_slices', 'STU00001')
# data_dir_3d = os.path.join(dali_extra_dir, 'db', '3D', 'MRI', 'Knee', 'npy_3d', 'STU00001')
# data_dir = os.path.join(data_dir_2d, 'SER00001')
# # Listing all *.npy files in data_dir
# data_dir = '../..'
data_dir = '.'
files = sorted([f for f in os.listdir(data_dir) if '.npy' in f])
# files = sorted([f for f in os.listdir(data_dir) if 'Inputcupy' in f])
testmodelbsz = 1
# files  = files[0:5]

@pipeline_def(batch_size=batch_size, num_threads=4, device_id=0)
def pipe_gds():
    data = fn.readers.numpy(device='gpu', file_root=data_dir, files=files, register_buffers = True, cache_header_information=True)
    return data

# def pipe_gds():
#     data = fn.readers.numpy(device='gpu', file_root=data_dir, files=files)
#     return data

#DALI_CPU_Batch
# def pipe_gds():
#     data = fn.readers.numpy(device='cpu', file_root=data_dir, files=files)
#     return data

# def run(p):
#     p.build()  # build the pipeline
#     outputs = p.run()  # Run once
#     # Getting the batch as a list of numpy arrays, for displaying
#     batch = [np.array(outputs[0][s]) for s in range(batch_size)]
#     return batch

# print(files)
# def pipe_gds(filename):
#     data = fn.readers.numpy(device='gpu', file_root=data_dir, files=filename, register_buffers = True, cache_header_information=True)
#     return data

N = 50
average_save_tensor = 0
average_save_numpy = 0
average_save_cupy = 0
#使用torch.save()写张量到SSD
for i in range(N):
    Inputimages = torch.randn(testmodelbsz, 256, 56, 56).cuda()
    # Inputimages = torch.randn(testmodelbsz, 256, 56, 56)
    path = 'Inputtensor' + str(i) + '.pt'
    path2 = 'Inputnumpy' + str(i) + '.npy'
    path3 = 'Inputcupy'+ str(i)
    # Inputimages = torch.randn(512, 256, 56, 56)
    # path = 'Inputtensor.pt'
    # path2 = 'Inputnumpy.npy'
    #save by torch.save()
    # torch.cuda.synchronize()
    # begin = time.time()
    # torch.save(Inputimages, path)
    # torch.cuda.synchronize()
    # end = time.time()
    # time1 = end -begin
    # average_save_tensor += time1
    # print("torchsave spendtime is", time1)
    #save by GDS
    # torch.cuda.synchronize()
    # begin = time.time()
    # Inputcupy = cupy.asarray(Inputimages)
    # f = kvikio.CuFile(path3, "w")
    # f.write(Inputcupy)
    # f.close()
    # torch.cuda.synchronize()
    # end = time.time()
    # time3 = end - begin
    # print("cupysave spendtime is", time3)
    # if i > 0:
    #     average_save_cupy += time3
    #save by numpy
    torch.cuda.synchronize()
    begin = time.time()
    Inputnumpy = Inputimages.cpu().numpy()
    end = time.time()
    print("transfer time is", end - begin)
    torch.cuda.synchronize()
    begin = time.time()
    np.save(path2, Inputnumpy)
    torch.cuda.synchronize()
    end = time.time()
    time2 = end - begin
    average_save_numpy += time2
    print("numpysave spendtime is", time2)
    # os.remove(path)
    # os.remove(path2)
    # os.remove(path3)
print("average tensorsave spendtime is", average_save_tensor / N, "average numpysave spendtime is" , average_save_numpy / N,"average cupysave spendtime is" , average_save_cupy / (N -1))

average_load_tensor = 0
average_load_numpy = 0
average_transfer_numpy = 0
Inputimages = torch.empty(testmodelbsz, 256, 56, 56).to(device)
# for i in range(N):
#     path = 'Inputtensor' + str(i) + '.pt'
#     path2 = 'Inputnumpy' + str(i) + '.npy'
#     # # 使用torch.load()读到GPU的时间
#     # # path = 'Inputtensor.pt'
#     # torch.cuda.synchronize()
#     # begin = time.time()
#     # Inputimages = torch.load(path, map_location=lambda storage, loc: storage.cuda(0))
#     # torch.cuda.synchronize()
#     # end = time.time()
#     # time1 = end - begin
#     # average_load_tensor += time1
#     # os.remove(path)
#     # print("torch.load spendtime is", time1)
#     # #使用DALi读到GPU的时间
#     p = pipe_gds(filename=path2)
#     p.build()
#     torch.cuda.synchronize()
#     begin = time.time()
#     pipe_out = p.run()
#     torch.cuda.synchronize()
#     end = time.time()
#     time1 = end - begin
#     # print("numpyload spendtime is", time1)
#     # print(pipe_out[0][0])
#     torch.cuda.synchronize()
#     begin = time.time()
#     nvidia.dali.plugin.pytorch.feed_ndarray(pipe_out[0][0], Inputimages)
#     torch.cuda.synchronize()
#     end= time.time()
#     time2 = end - begin
#     # print("transfer time is", time2)
#     time3 = time1 + time2
#     if i > 1:
#         average_load_numpy += time3
#         average_transfer_numpy += time2
#     # print("load time", time1)
#     # print("transfer time", time2)
#     os.remove(path2)
#     print("total gdsload time",time3)
# print("average tensorload spendtime is", average_load_tensor / N , "average numpyload spendtime is" , average_load_numpy / (N - 2),"average transfer spendtime is" , average_transfer_numpy / (N - 2))

#DALI_Batch Load
average_transfer_pipeline_numpy = 0
p = pipe_gds()
p.build()
for i in range(N):
    torch.cuda.synchronize()
    begin = time.time()
    pipe_out= p.run()
    torch.cuda.synchronize()
    end = time.time()
    time1 = end - begin
    print("numpyload pipeline spendtime is", time1)
    print(len(pipe_out[0]))
    if i > 1:
        average_transfer_pipeline_numpy += time1
print("average numpyload pipeline spendtime is", average_transfer_pipeline_numpy / ((N -2) * batch_size))

# #DALI_Batch Load_CPU
# average_transfer_pipeline_numpy = 0
# p = pipe_gds()
# p.build()
# for i in range(N):
#     torch.cuda.synchronize()
#     begin = time.time()
#     pipe_out= p.run()
#     torch.cuda.synchronize()
#     end = time.time()
#     time1 = end - begin
#     print("numpyload pipeline spendtime is", time1)
#     print(len(pipe_out[0]))
#     if i > 1:
#         average_transfer_pipeline_numpy += time1
# print("average numpyload pipeline spendtime is", average_transfer_pipeline_numpy / ((N -2) * batch_size))

# averagemovetime = 0
# #CPU到GPU传输测试
# for i in range(N):
#     Inputimages = torch.zeros(testmodelbsz, 256, 56, 56)
#     torch.cuda.synchronize()
#     begin = time.time()
#     Inputimages.to(device)
#     torch.cuda.synchronize()
#     end = time.time()
#     if i > 0:
#         averagemovetime += end - begin
#     print("move time is", end - begin)
# print("average move time is", averagemovetime/(N -1 ))

# #使用Numpy读数据时间
# average_load_numpy = 0
# for i in range(N):
#     path = 'Inputnumpy' + str(i) + '.npy'
#     # 使用np.load()读到GPU的时间
#     torch.cuda.synchronize()
#     begin = time.time()
#     Inputimages = torch.from_numpy(np.load(path)).to(device)
#     torch.cuda.synchronize()
#     end = time.time()
#     time1 = end - begin
#     if i > 1:
#         average_load_numpy += time1
#     print("numpy.load spendtime is", time1)
#     os.remove(path)
# print("average numpyload spendtime is" , average_load_numpy / (N - 2))

#使用kvikio读数据时间
# averageloadtime = 0
# #CPU到GPU传输测试
# cupyimages = cupy.asarray(torch.empty(testmodelbsz, 256, 56, 56))
# for i in range(N):
#     torch.cuda.synchronize()
#     path3 = 'Inputcupy' + str(i)
#     begin = time.time()
#     Inputimages = cupy.empty_like(cupyimages)
#     f = kvikio.CuFile(path3, "r")
#     # Read whole array from file
#     f.read(Inputimages)
#     Inputtensor = torch.as_tensor(Inputimages, device = device)
#     torch.cuda.synchronize()
#     end = time.time()
#     if i > 0:
#         averageloadtime += end - begin
#     print("load time is", end - begin)
#     os.remove(path3)
# print("average load time is", averageloadtime/(N -1))

# data_gds = pipe_out[0].as_cpu().as_array()  # as_cpu() to copy the data back to CPU memory
# print(data_gds.shape)
Weigaa commented 2 years ago

Hi @azrael417 , I am sorry that it took me longer to complete the experiment as the equipment in our lab is shared by multiple people. I generated 64 blocks of size 49MB, to make them a total size of about 3GB. For each test I use a DALI reader with a batchsize of 4 to read the data 16 times, ensuring that each data is only read once. The result of clearing the cache is shown below.


              total        used        free      shared  buff/cache   available
Mem:          64287        2893       61033           9         360       60862
Swap:          2047           0        2047

We test the native and compat mode both on cache and non_cache, the test results are as follows: <html xmlns:v="urn:schemas-microsoft-com:vml" xmlns:o="urn:schemas-microsoft-com:office:office" xmlns:x="urn:schemas-microsoft-com:office:excel" xmlns="http://www.w3.org/TR/REC-html40">

datasize | number | totalsize | batch_size | native_cache(GB/s) | native_nocache(GB/s) | compat_cache(GB/s) | compat_nocache(GB/s) | native_cache(samples/s) | native_nocache(samples/s) | compat_cache(samples/s) | compat_nocache(samples/s) -- | -- | -- | -- | -- | -- | -- | -- | -- | -- | -- | -- 49 | 64 | 3136 | 4 | 2.04319225 | 2.046687874 | 7.530935238 | 1.965963948 | 2732.707088 | 2737.382378 | 10072.39534 | 2629.416598

The experimental results seem to indicate that the fast reads and writes in compatibility mode come from the use of cache. However, my PCIe bandwidth could achieve almost 16GB/s, but even using native GDS could get almost 2.1GB/s, why the bandwidth is so slow and how could I get higher bandwidth like GDS developer technical blog

Weigaa commented 2 years ago

Hi, @azrael417 I have done more experiments to verify the performance difference between GDS native and GDS compat, and the impact of pipeline on performance. We optimize GDS performance by adjusting the pipeline. At this point, we find that the performance of GDS native and GDS compat is very close. When the block size is larger than 50MB, GDS native is better, and when the block size is not larger than 50MB, GDS compat is better. Our experiments ensure that no cache/buffer is used. The detailed experimental results are shown in the following table.(In our experiments, we avoid the build overhead when the pipeline is not 1.) <html xmlns:v="urn:schemas-microsoft-com:vml" xmlns:o="urn:schemas-microsoft-com:office:office" xmlns:x="urn:schemas-microsoft-com:office:excel" xmlns="http://www.w3.org/TR/REC-html40">

Datasize(MB) | torch.load()read bandwidth | DALI Bandwidth (MB/s)  comp pipeline=1 | DALI Bandwidth(MB/s)  comp pipeline=best | np.load() read bandwidth | Kvikio_gds read bandwidth | DALI Bandwidth (MB/s)  no_comp pipeline=1 | DALI Bandwidth(MB/s)  no_comp pipeline=best -- | -- | -- | -- | -- | -- | -- | -- 1568 | 836.1328854 | 2153.2546 | 2486.323634 | 1057.031145 | 2166.344294 | 2449.081594 | 2498.008603 784 | 890.9090909 | 2191.16825 | 2229.17259 | 1098.80869 | 2210.318579 | 2418.260333 | 2498.406628 392 | 847.5675676 | 2299.120235 | 2490.47014 | 1198.776758 | 2218.449349 | 2314.049587 | 2501.595405 196 | 906.1488673 | 2120.0649 | 2251.062364 | 1196.581197 | 1984.408221 | 2207.704438 | 2262.495671 98 | 956.097561 | 1845.922019 | 2499.362408 | 1179.302046 | 2049.351736 | 1952.191235 | 2503.832397 49 | 844.8275862 | 1323.430115 | 2239.488117 | 1134.259259 | 1683.848797 | 1615.029664 | 2496.179317 24.5 | 1079.295154 | 803.2786885 | 2493.131169 | 1456.599287 | 1647.612643 | 1240.506329 | 2484.535037 12.25 | 1042.553191 | 451.1970534 | 2235.809454 | 1676.474613 | 1510.480888 | 744.2284326 | 2229.299363 6.125 | 964.7188534 | 414.1311697 | 2229.705133 | 1411.61558 | 1161.577849 | 396.9539857 | 2196.127644 3.0625 | 735.6473697 | 247.9757085 | 2195.340502 | 1294.378698 | 896.7789165 | 232.5360668 | 2119.377163

azrael417 commented 2 years ago

Hello @Weigaa,

I will look at the code you provided. Concerning the BW: according to the specs website for your optane drive (I picked the 280 GB version but the others will be close in perf to that one), the max BW for this config is 2.5 GB/sec and that is a "fantasy number" (or marketing number if you want to call it that :)) you only get close to in very specific edge cases when all stars are aligned. Getting 2.1 GB/sec is already very good given that specs imo.

Let me run a few tests and come back to you.

Best Thorsten

Weigaa commented 2 years ago

Hi,@azrael417 I have adjusted some of the code and removed some redundant parts, maybe it will be easier for you to use the following code.

import torch
from nvidia.dali import pipeline_def, fn
import nvidia.dali.plugin.pytorch
import os
import time
# misc python stuff
import numpy as np
from glob import glob
import shutil
import tempfile
import cupy
import kvikio
# visualization
from PIL import Image
device=torch.device('cuda:0')
batch_size = 1  # to be used in pipelines
dali_extra_dir = os.environ['DALI_EXTRA_PATH']
data_dir = '.'
files = sorted([f for f in os.listdir(data_dir) if '.npy' in f])
testmodelbsz = 4
@pipeline_def(batch_size=batch_size, num_threads=8, device_id=0)
def pipe_gds():
    data = fn.readers.numpy(device='gpu', file_root=data_dir, files=files, register_buffers = True, cache_header_information=True)
    return data
N = 50 * batch_size
average_save_tensor = 0
average_save_numpy = 0
average_save_cupy = 0
#使用torch.save()写张量到SSD
for i in range(N):
    Inputimages = torch.randn(testmodelbsz, 256, 56, 56).cuda()
    # Inputimages = torch.randn(testmodelbsz, 256, 56, 56)
    path = 'Inputtensor' + str(i) + '.pt'
    path2 = 'Inputnumpy' + str(i) + '.npy'
    path3 = 'Inputcupy'+ str(i)
    #save by numpy
    torch.cuda.synchronize()
    begin = time.time()
    Inputnumpy = Inputimages.cpu().numpy()
    end = time.time()
    print("transfer time is", end - begin)
    torch.cuda.synchronize()
    begin = time.time()
    np.save(path2, Inputnumpy)
    torch.cuda.synchronize()
    end = time.time()
    time2 = end - begin
    average_save_numpy += time2
    print("numpysave spendtime is", time2)
    # os.remove(path)
    # os.remove(path2)
    # os.remove(path3)
print("average tensorsave spendtime is", average_save_tensor / N, "average numpysave spendtime is" , average_save_numpy / N,"average cupysave spendtime is" , average_save_cupy / (N -1))
average_load_tensor = 0
average_load_numpy = 0
average_transfer_numpy = 0
Inputimages = torch.empty(testmodelbsz, 256, 56, 56).to(device)
N=50
# #DALI_Batch Load
average_transfer_pipeline_numpy = 0
p = pipe_gds()
p.build()
# N = N/batch_size
for i in range(N):
    torch.cuda.synchronize()
    begin = time.time()
    pipe_out= p.run()
    torch.cuda.synchronize()
    end = time.time()
    time1 = end - begin
    print("numpyload pipeline spendtime is", time1)
    # print(pipe_out)
    print(len(pipe_out[0]))
    if i > 1:
        average_transfer_pipeline_numpy += time1
print("average numpyload pipeline spendtime is", average_transfer_pipeline_numpy / ((N -2) * batch_size))
azrael417 commented 2 years ago

Hello @Weigaa

I modified your benchmark and ran it inside the 22.06 pytorch container on LUSTRE (I do not have a supported NVME atm):

GDS throughput: 843.87 [samples/s]
GDS effective BW: 2.52 [GB/s]
warming up
starting the benchmark
POSIX throughput: 254.29 [samples/s]
POSIX effective BW: 0.76 [GB/s]

The benchmark code I was using is:

import torch
from nvidia.dali import pipeline_def, fn
import nvidia.dali.plugin.pytorch
import os
import time
# misc python stuff
import numpy as np
from glob import glob
import shutil
import tempfile
from tqdm import tqdm  
#import cupy
#import kvikio
# visualization
from PIL import Image

# random numbers
from numpy.random import default_rng
rng = default_rng(666)

# set device
generate_files = False
batch_size = 1024 # to be used in pipelines
data_dir = '/data'
img_shape = (256, 56, 56)
N_warm = 20
N = 100

@pipeline_def(batch_size=batch_size, num_threads=4, device_id=0)
def pipe_gds():
    data = fn.readers.numpy(device='gpu', file_root=data_dir, files=files, register_buffers = True, cache_header_information=True)
    return data

@pipeline_def(batch_size=batch_size, num_threads=4, device_id=0)
def pipe_cpu():
    data = fn.readers.numpy(device='cpu', file_root=data_dir, files=files, register_buffers = True, cache_header_information=True)
    data = data.gpu()
    return data

# derived parameters
num_samples = (N + N_warm) * batch_size
average_save_tensor = 0
average_save_numpy = 0
average_save_cupy = 0
img_bytes = np.prod(img_shape) * 4

# get files
files = sorted([f for f in os.listdir(data_dir) if f.endswith('.npy')])

if len(files) < num_samples:
    generate_files = True
    print(f"found files in {data_dir} but not sufficiently many")

if generate_files:
    print("creating input files")

    for i in tqdm(range(num_samples)):
        img = rng.random(size=img_shape, dtype=np.float32)
        path = 'Inputnumpy' + str(i) + '.npy'

        #save by numpy
        np.save(os.path.join(data_dir, path), img)

    print("saving done")

# get files
files = sorted([f for f in os.listdir(data_dir) if f.endswith('.npy')])

# DALI_Batch Load
p = pipe_gds()
p.build()

# start benchmark
# warmup
print("warming up")
for i in range(N_warm):
  pipe_out = p.run()

# sync up
torch.cuda.synchronize()

# start real run
print("starting the benchmark")
start = time.perf_counter_ns()

for i in range(N):
    pipe_out = p.run()

# sync up
torch.cuda.synchronize()
end = time.perf_counter_ns()
duration = (end - start) * 10**(-9)

print(f"GDS throughput: {float(N * batch_size) / duration:.2f} [samples/s]")
print(f"GDS effective BW: {float(N * batch_size * img_bytes) / duration / (1024*1024*1024):.2f} [GB/s]")

# do the CPU pipeline runs
p = pipe_cpu()
p.build()

# start benchmark
# warmup
print("warming up")
for i in range(N_warm):
  pipe_out = p.run()

# sync up
torch.cuda.synchronize()

# start real run
print("starting the benchmark")
start = time.perf_counter_ns()

for i in range(N):
    pipe_out = p.run()

# sync up
torch.cuda.synchronize()
end = time.perf_counter_ns()
duration = (end - start) * 10**(-9)

print(f"POSIX throughput: {float(N * batch_size) / duration:.2f} [samples/s]")
print(f"POSIX effective BW: {float(N * batch_size * img_bytes) / duration / (1024*1024*1024):.2f} [GB/s]")

Please note that I do one full pass and measure the BW based on that. Here, the POSIX IO is clearly slower. Please let me know what you think (or let me know if you spot a bug in the script). The Dockerfile for the container I built is:

ARG dlfw_version=22.06
FROM nvcr.io/nvidia/pytorch:22.06-py3

# install GDS prereqs
RUN apt update -y && apt install -y liburcu-dev linux-headers-generic

# install GDS
RUN wget https://developer.download.nvidia.com/compute/cuda/repos/ubuntu2004/x86_64/cuda-ubuntu2004.pin && \
    mv cuda-ubuntu2004.pin /etc/apt/preferences.d/cuda-repository-pin-600 && \
    wget https://developer.download.nvidia.com/compute/cuda/11.7.0/local_installers/cuda-repo-ubuntu2004-11-7-local_11.7.0-515.43.04-1_amd64.deb && \
    dpkg -i cuda-repo-ubuntu2004-11-7-local_11.7.0-515.43.04-1_amd64.deb && \
    cp /var/cuda-repo-ubuntu2004-11-7-local/cuda-*-keyring.gpg /usr/share/keyrings/ && \
    apt-get update -y && apt install -y libcufile-dev-11-7

# install python stuff
RUN pip install tqdm

#create additional folders for mapping data in
RUN mkdir -p /data

# copy source code
COPY gds_microbenchmark.py /opt/benchmark/gds_microbenchmark.py

Best Thorsten

Weigaa commented 2 years ago

Hi, @azrael417 I reran your benchmark on my platform with a little modification. I change the pram N and N_warn by half due to our Optane SSD only 256GB capacity.

N_warm = 10
N = 50

The results are as follows:

GDS throughput: 674.40 [samples/s]
GDS effective BW: 2.02 [GB/s]
POSIX throughput: 669.65 [samples/s]
POSIX effective BW: 2.00 [GB/s]

I also test GDS COMPAT MODE by: modprobe -r nvidia_fs The results are:

GDS throughput: 724.53 [samples/s]
GDS effective BW: 2.17 [GB/s]

I got the same conclusion on your code as I did before on my own platform. Can you please test the bandwidth in GDS compat mode on your platform? (by using modprobe -r nvidia_fs, then run your code again) I think your slower POSIX interface speeds may stem from the Lustre file system, and I'm not sure if the Lustre server is mounted on an NVMe SSD or a SATA SSD or HDD? Also, you are achieving higher bandwidth on Lustre, which may be related to the additional optimization of Lustre by GDS, but I am not sure.

Weigaa commented 2 years ago

Hi @azrael417 I conducted another experiment on the same platform and the results are shown in the table below. GDS native:

GDS throughput: 741.73 [samples/s]
GDS effective BW: 2.22 [GB/s]

GDS compat:

GDS throughput: 804.74 [samples/s]
GDS effective BW: 2.41 [GB/s]

POSIX:

POSIX throughput: 739.50 [samples/s]
POSIX effective BW: 2.21 [GB/s]

The IO throughput increases in all three cases, but their proportional relationship is still the same.

JanuszL commented 2 years ago

@Weigaa,

I'm sorry but I don't have access to a similar HW configuration you use to verify the results you get. I would say that GDS is mostly to offload the data loading from the CPU when your CPU is busy. In your case, the CPU is idle and can be fully dedicated to IO. I expect that putting more stress on it would decrease the BW. Regarding the better results between POSIX and GDS in compat mode may mean that fn.readers.numpy for CPU can still be improved and/or the additional copy to the GPU data = data.gpu() just adds overhead compared to the GDS even in the compat mode.

Weigaa commented 2 years ago

Hi,

I repeated the above experiment on a server with 4 A100s. I upgraded the DALI version to 1.8 and the corresponding CUDA version to 11.7. Since my buffer has 360GB, I only run one test at a time and then empty the buffer. I tested the robustness of GDS, GDS compatibility mode (GDS_C), and POSIX by generating different CPU and memory stress loads (0%-100%) with the stress tool. The test results are shown in the following table.

Q}7R`B(5_U951I8G@X$2674

I have noticed several strange phenomena. ① All APIs are not at the highest IO bandwidth when no stress is applied. ② GDS is more affected by CPU than POSIX and GDS_COMPAT.

Weigaa commented 2 years ago

Hi, @JanuszL Things seemed to change when I upped to a higher CPU load. It seems that GDS is less affected than POSIX. Interestingly, the GDS-compatible mode was barely affected by the increased CPU load. 1665760041499

KiranModukuri commented 2 years ago

@Weigaa Thanks for sharing the results.

I looked at the sample and tried on my box. The reason the GDS in P2P mode works slow is because of the image size (256 56 56 ) * 4 + 128 byte header. The header throws the alignment of for GDS and results in small reads at end of each file for 128 bytes, this slows a bit. For Posix and Compat Mode , they are seeing caching benefits for smaller samples. However as the data set size increases, the throughput normalizes to disk speeds. The reason compat gets better is because of multithreading. DALI CPU pipeline is single threaded and by default using MMAP and not posix read. The MMAP actually helps to compensate for single threaded POSIX. I tried the variable “dont_use_mmap = True” and the I see the single threaded performance.

TRUE GDS ( 3M + 128 bytes) starting the benchmark GDS throughput: 442.12 [samples/s] GDS effective BW: 1.32 [GB/s]

GDS COMPAT MODE ( 3M + 128 bytes) GDS throughput: 477.59 [samples/s] GDS effective BW: 1.43 [GB/s]

POSIX throughput: 216.75 [samples/s] POSIX effective BW: 0.65 [GB/s]

MMAP throughput: 453.83 [samples/s] MMAP effective BW: 1.36 [GB/s]

I was able to speed up GDS path by reducing the DALI_GDS_CHUNK_SIZE to 128KB on my setup.

(datascience) kmodukuri@kmodukuri-desk:/1tb/work/DL$ rm cufile.log; DALI_GDS_CHUNK_SIZE=4M python dali2_gds.py warming up starting the benchmark GDS throughput: 442.88 [samples/s] GDS effective BW: 1.32 [GB/s] (datascience) kmodukuri@kmodukuri-desk:/1tb/work/DL$ rm cufile.log; DALI_GDS_CHUNK_SIZE=2M python dali2_gds.py warming up starting the benchmark GDS throughput: 445.40 [samples/s] GDS effective BW: 1.33 [GB/s] (datascience) kmodukuri@kmodukuri-desk:/1tb/work/DL$ rm cufile.log; DALI_GDS_CHUNK_SIZE=2M python dali2_gds.py warming up starting the benchmark GDS throughput: 445.64 [samples/s] GDS effective BW: 1.33 [GB/s] (datascience) kmodukuri@kmodukuri-desk:/1tb/work/DL$ rm cufile.log; DALI_GDS_CHUNK_SIZE=1M python dali2_gds.py warming up starting the benchmark GDS throughput: 454.24 [samples/s] GDS effective BW: 1.36 [GB/s] (datascience) kmodukuri@kmodukuri-desk:/1tb/work/DL$ rm cufile.log; DALI_GDS_CHUNK_SIZE=512k python dali2_gds.py warming up starting the benchmark GDS throughput: 463.50 [samples/s] GDS effective BW: 1.39 [GB/s] (datascience) kmodukuri@kmodukuri-desk:/1tb/work/DL$ rm cufile.log; DALI_GDS_CHUNK_SIZE=256k python dali2_gds.py warming up starting the benchmark GDS throughput: 466.75 [samples/s] GDS effective BW: 1.40 [GB/s] (datascience) kmodukuri@kmodukuri-desk:/1tb/work/DL$ rm cufile.log; DALI_GDS_CHUNK_SIZE=128k python dali2_gds.py warming up starting the benchmark GDS throughput: 480.09 [samples/s] GDS effective BW: 1.44 [GB/s] (datascience) kmodukuri@kmodukuri-desk:/1tb/work/DL$ rm cufile.log; DALI_GDS_CHUNK_SIZE=64k python dali2_gds.py warming up starting the benchmark GDS throughput: 495.72 [samples/s] GDS effective BW: 1.48 [GB/s] (datascience) kmodukuri@kmodukuri-desk:/1tb/work/DL$ rm cufile.log; DALI_GDS_CHUNK_SIZE=32k python dali2_gds.py warming up starting the benchmark GDS throughput: 493.95 [samples/s] GDS effective BW: 1.48 [GB/s] (datascience) kmodukuri@kmodukuri-desk:/1tb/work/DL$ rm cufile.log; DALI_GDS_CHUNK_SIZE=16k python dali2_gds.py warming up starting the benchmark GDS throughput: 396.64 [samples/s] GDS effective BW: 1.19 [GB/s] (datascience) kmodukuri@kmodukuri-desk:/1tb/work/DL$ rm cufile.log; DALI_GDS_CHUNK_SIZE=64k python dali2_gds.py warming up starting the benchmark GDS throughput: 497.50 [samples/s] GDS effective BW: 1.49 [GB/s]

so in effect the size of the file not aligned to 4096 bytes is hurting true GDS as there is a 128 byte copy D-D. From experiments, having a smaller chunk size is making the pipeline smoother for cudaMemcpyAsync and the Reader.

In case of compat and MMAP, the IO is done at full 3M+128 in one call. so a DALI_GDS_CHUNK_SIZE=4M will work better for compat mode.

Weigaa commented 2 years ago

Thanks, @KiranModukuri Now I understand if the data chunk size satisfies the alignment of GDS could affect the IO performance. However, I still have some confusion based on your answer. Looking forward to your reply: ①You said that "DALI CPU pipeline is single threaded and by default using MMAP and not posix read", but in my experiments, I have used multi-threading techniques when defining the pipeline (@pipeline_def(batch_size=batch_size, num_threads=4, device_id=0)), will it take effect in the CPU's pipeline? ②Why is "reducing the DALI_GDS_CHUNK_SIZE to 128KB" valid? If the slow GDS speed is due to the 128 bytes header not being aligned with 4096 bytes, reducing the DALI_GDS_CHUNK_SIZE does not seem to solve the problem? ③Is the file size of the aligned GDS related to the "DALI_GDS_CHUNK_SIZE" setting or is it always aligned to 4096 bytes? Thank you again.

Weigaa commented 2 years ago

In addition, we tested the effect of different chunk sizes on the DALI GDS and the experimental results are shown in the following table: <html xmlns:v="urn:schemas-microsoft-com:vml" xmlns:o="urn:schemas-microsoft-com:office:office" xmlns:x="urn:schemas-microsoft-com:office:excel" xmlns="http://www.w3.org/TR/REC-html40">

Method\chunk size | 16M | 8M | 4M | 2M | 1M | 512k | 256k | 128k | 64K | 32K | 16K | 8K | 4K -- | -- | -- | -- | -- | -- | -- | -- | -- | -- | -- | -- | -- | -- GDS (GB/s) | 2.54 | 2.56 | 2.55 | 2.54 | 2.48 | 2.61 | 2.66 | 2.15 | 1.41 | 0.75 | 0.36 | 0.16 | 0.21 GDS (Samples/s) | 850.91 | 854.55 | 851.14 | 848.40 | 829.22 | 873.97 | 889.11 | 718.02 | 469.92 | 251.84 | 119.34 | 54.36 | 71.30

The experimental results show that optimal throughput is achieved on our server using a chunk size of 256k.