Closed AlexWang1900 closed 4 years ago
Could it be that you are running Xorg on one of the GPUs, so that when TF/NCCL runs, Xorg struggles to get access to the GPU ? If so (and if it easy to try), could you try running Xorg on the CPU integrated GPU and see if the problem is still there ?
I don't think NCCL or TF have much control over how the GPU is shared between CUDA compute and Xorg, so you might want to look for driver configuration. Note however that sharing the GPU between Xorg and TF might affect performance negatively as every time Xorg would get a time slice of one GPU, it would stop TF completely on that GPU, and eventually slow down the other GPU as well as the two GPUs are synchronized. I don't see why NVLink would make a difference in behavior, aside from the fact that it might run much faster, hence make it harder for Xorg to get GPU resources.
@sjeaugey I don't think it is the case GPU resources not enough, because: when I use "strategy = tf.distribute.MirroredStrategy(cross_device_ops=tf.distribute.ReductionToOneDevice())" , according to TF guys not calling NCCL, the code runs well ,and the GPU-Utilization are 20~% for both GPUs, and memory usage is low around 1GB out of 11GB for each GPU.
$ nvidia-smi
Wed Jun 10 10:31:40 2020
+-----------------------------------------------------------------------------+
| NVIDIA-SMI 440.82 Driver Version: 440.82 CUDA Version: 10.2 |
|-------------------------------+----------------------+----------------------+
| GPU Name Persistence-M| Bus-Id Disp.A | Volatile Uncorr. ECC |
| Fan Temp Perf Pwr:Usage/Cap| Memory-Usage | GPU-Util Compute M. |
|===============================+======================+======================|
| 0 GeForce RTX 208... Off | 00000000:01:00.0 On | N/A |
| 0% 33C P2 66W / 260W | 1272MiB / 11016MiB | 22% Default |
+-------------------------------+----------------------+----------------------+
| 1 GeForce RTX 208... Off | 00000000:02:00.0 Off | N/A |
| 0% 33C P2 61W / 260W | 959MiB / 11019MiB | 17% Default |
+-------------------------------+----------------------+----------------------+
+-----------------------------------------------------------------------------+
| Processes: GPU Memory |
| GPU PID Type Process name Usage |
|=============================================================================|
| 0 1086 G /usr/lib/xorg/Xorg 35MiB |
| 0 1727 G /usr/lib/xorg/Xorg 76MiB |
| 0 1926 G /usr/bin/gnome-shell 191MiB |
| 0 6898 C /usr/bin/python3 947MiB |
| 1 6898 C /usr/bin/python3 947MiB |
+-----------------------------------------------------------------------------+
But for the exact same code,when I use strategy = tf.distribute.MirroredStrategy() , as a default strategy it is "all_reduce ", system hangs.
And as I mentioned, if I remove the NVLINK Bridge hardware, I can run the code using both strategies, no hanging.
And as I have ran so many other TF codes on one GPU , the GPU utilization goes up to 98% and memory goes to 10.8GB, no hanging ever happened.
It only hangs after I bought a NVLINK bridge and I installed it and using NCCL.
I don't have a integrated GPU, as you know, I bought 2 NVIDIA 2080TIs, HOW would I know I need a integrated GPU??? LOL~~~~
I will try to run remotely the nccl test and TF code, to see if it is NCCL can't run perfectly with a GPU connected to a display monitor.
@sjeaugey I run TF code as mentioned above and in original TF bug page. (code is below) https://github.com/tensorflow/docs/blob/master/site/en/tutorials/distribute/keras.ipynb remotely from another PC, using Jupyter as a web server. and I disconnect the display cable from 2080ti.
it's still hanging,
model.fit(train_dataset, epochs=1, callbacks=callbacks)
INFO:tensorflow:batch_all_reduce: 6 all-reduces with algorithm = nccl, num_packs = 1
INFO:tensorflow:Reduce to /job:localhost/replica:0/task:0/device:CPU:0 then broadcast to ('/job:localhost/replica:0/task:0/device:CPU:0',).
INFO:tensorflow:batch_all_reduce: 6 all-reduces with algorithm = nccl, num_packs = 1
INFO:tensorflow:Reduce to /job:localhost/replica:0/task:0/device:CPU:0 then broadcast to ('/job:localhost/replica:0/task:0/device:CPU:0',).
then it stops,
this code should run less than 2s, but after 30 min it is still hanging.
the normal output when not using NCCL is like this:
`model.fit(train_dataset, epochs=10, callbacks=callbacks)
Epoch 1/10
INFO:tensorflow:Reduce to /job:localhost/replica:0/task:0/device:GPU:0 then broadcast to ('/job:localhost/replica:0/task:0/device:GPU:0', '/job:localhost/replica:0/task:0/device:GPU:1').
INFO:tensorflow:Reduce to /job:localhost/replica:0/task:0/device:CPU:0 then broadcast to ('/job:localhost/replica:0/task:0/device:CPU:0',).
469/469 [==============================] - ETA: 0s - accuracy: 0.9232 - loss: 0.2688
Learning rate for epoch 1 is 0.0010000000474974513
469/469 [==============================] - 2s 4ms/step - accuracy: 0.9232 - loss: 0.2688 - lr: 0.0010
Epoch 2/10
456/469 [============================>.] - ETA: 0s - accuracy: 0.9739 - loss: 0.0879
Learning rate for epoch 2 is 0.0010000000474974513
469/469 [==============================] - 1s 3ms/step - accuracy: 0.9741 - loss: 0.0874 - lr: 0.0010
Epoch 3/10
452/469 [===========================>..] - ETA: 0s - accuracy: 0.9832 - loss: 0.0574
Learning rate for epoch 3 is 0.0010000000474974513
469/469 [==============================] - 1s 3ms/step - accuracy: 0.9830 - loss: 0.0577 - lr: 0.0010
Epoch 4/10
467/469 [============================>.] - ETA: 0s - accuracy: 0.9900 - loss: 0.0368
Learning rate for epoch 4 is 9.999999747378752e-05
469/469 [==============================] - 1s 3ms/step - accuracy: 0.9900 - loss: 0.0369 - lr: 1.0000e-04
Epoch 5/10
466/469 [============================>.] - ETA: 0s - accuracy: 0.9910 - loss: 0.0340
Learning rate for epoch 5 is 9.999999747378752e-05
469/469 [==============================] - 1s 3ms/step - accuracy: 0.9910 - loss: 0.0340 - lr: 1.0000e-04
Epoch 6/10
457/469 [============================>.] - ETA: 0s - accuracy: 0.9914 - loss: 0.0325
Learning rate for epoch 6 is 9.999999747378752e-05
469/469 [==============================] - 1s 3ms/step - accuracy: 0.9914 - loss: 0.0324 - lr: 1.0000e-04
Epoch 7/10
459/469 [============================>.] - ETA: 0s - accuracy: 0.9920 - loss: 0.0309
Learning rate for epoch 7 is 9.999999747378752e-05
469/469 [==============================] - 1s 3ms/step - accuracy: 0.9920 - loss: 0.0307 - lr: 1.0000e-04
Epoch 8/10
456/469 [============================>.] - ETA: 0s - accuracy: 0.9930 - loss: 0.0282
Learning rate for epoch 8 is 9.999999747378752e-06
469/469 [==============================] - 1s 3ms/step - accuracy: 0.9929 - loss: 0.0284 - lr: 1.0000e-05
Epoch 9/10
458/469 [============================>.] - ETA: 0s - accuracy: 0.9930 - loss: 0.0282
Learning rate for epoch 9 is 9.999999747378752e-06
469/469 [==============================] - 1s 3ms/step - accuracy: 0.9930 - loss: 0.0281 - lr: 1.0000e-05
Epoch 10/10
454/469 [============================>.] - ETA: 0s - accuracy: 0.9929 - loss: 0.0281
Learning rate for epoch 10 is 9.999999747378752e-06
469/469 [==============================] - 1s 3ms/step - accuracy: 0.9929 - loss: 0.0279 - lr: 1.0000e-05
@sjeaugey I reboot the system without a display cable connected to the 2080ti then I SSH to it from another PC through intranet.
then I start jupyter server remotely , and runs NCCL-TEST from another session also remotely using : $ ./all_reduce_perf -b 8 -e 16M -f 2 -g 2
at the same time, before NCCL-TEST finished running ,I ran some simple code
import numpy as np
print(2+4)
through jupyter notebook remotely , it is fine , it returns immediately: 6
it shows at least the cpu-dram-dmi-pch-usb-network(I am using a usb wifi card) is not hanging when remotely running NCCL-TEST
but I started another session remotely, fire command nvidia-smi, it never returns anything.
after a while , NCCL-TEST session returned:
# nThread 1 nGpus 2 minBytes 8 maxBytes 16777216 step: 2(factor) warmup iters: 5 iters: 20 validation: 1
#
# Using devices
# Rank 0 Pid 1711 on w-system device 0 [0x01] GeForce RTX 2080 Ti
# Rank 1 Pid 1711 on w-system device 1 [0x02] GeForce RTX 2080 Ti
#
# out-of-place in-place
# size count type redop time algbw busbw error time algbw busbw error
# (B) (elements) (us) (GB/s) (GB/s) (us) (GB/s) (GB/s)
8 2 float sum 7.46 0.00 0.00 0e+00 7.37 0.00 0.00 0e+00
16 4 float sum 7.43 0.00 0.00 0e+00 7.45 0.00 0.00 0e+00
32 8 float sum 7.39 0.00 0.00 0e+00 7.38 0.00 0.00 0e+00
64 16 float sum 7.52 0.01 0.01 0e+00 7.36 0.01 0.01 0e+00
128 32 float sum 7.55 0.02 0.02 0e+00 7.45 0.02 0.02 0e+00
256 64 float sum 7.57 0.03 0.03 0e+00 7.44 0.03 0.03 0e+00
512 128 float sum 7.61 0.07 0.07 0e+00 7.54 0.07 0.07 0e+00
1024 256 float sum 8.20 0.12 0.12 0e+00 8.06 0.13 0.13 0e+00
2048 512 float sum 8.54 0.24 0.24 0e+00 8.44 0.24 0.24 0e+00
4096 1024 float sum 9.92 0.41 0.41 0e+00 9.78 0.42 0.42 0e+00
8192 2048 float sum 12.10 0.68 0.68 0e+00 11.92 0.69 0.69 0e+00
16384 4096 float sum 14.77 1.11 1.11 0e+00 14.38 1.14 1.14 0e+00
32768 8192 float sum 16.97 1.93 1.93 0e+00 16.64 1.97 1.97 0e+00
65536 16384 float sum 21.45 3.06 3.06 0e+00 20.51 3.20 3.20 0e+00
131072 32768 float sum 35.61 3.68 3.68 0e+00 35.85 3.66 3.66 0e+00
262144 65536 float sum 42.46 6.17 6.17 0e+00 41.73 6.28 6.28 0e+00
524288 131072 float sum 50.70 10.34 10.34 0e+00 52.69 9.95 9.95 0e+00
1048576 262144 float sum 72.64 14.44 14.44 0e+00 72.58 14.45 14.45 0e+00
2097152 524288 float sum 121.7 17.23 17.23 0e+00 118.7 17.66 17.66 0e+00
4194304 1048576 float sum 215.4 19.47 19.47 0e+00 215.1 19.50 19.50 0e+00
8388608 2097152 float sum 400.1 20.96 20.96 0e+00 399.7 20.99 20.99 0e+00
16777216 4194304 float sum 779.8 21.51 21.51 0e+00 780.7 21.49 21.49 0e+00
# Out of bounds values : 0 OK
# Avg bus bandwidth : 5.53153
then I ran nvidia-smi again ,it returns:
+-----------------------------------------------------------------------------+
| NVIDIA-SMI 440.82 Driver Version: 440.82 CUDA Version: 10.2 |
|-------------------------------+----------------------+----------------------+
| GPU Name Persistence-M| Bus-Id Disp.A | Volatile Uncorr. ECC |
| Fan Temp Perf Pwr:Usage/Cap| Memory-Usage | GPU-Util Compute M. |
|===============================+======================+======================|
| 0 GeForce RTX 208... Off | 00000000:01:00.0 Off | N/A |
| 0% 38C P0 62W / 260W | 0MiB / 11016MiB | 0% Default |
+-------------------------------+----------------------+----------------------+
| 1 GeForce RTX 208... Off | 00000000:02:00.0 Off | N/A |
| 0% 38C P0 28W / 260W | 0MiB / 11019MiB | 0% Default |
+-------------------------------+----------------------+----------------------+
+-----------------------------------------------------------------------------+
| Processes: GPU Memory |
| GPU PID Type Process name Usage |
|=============================================================================|
| No running processes found |
+-----------------------------------------------------------------------------+
It is clear that no XORG or any other program is using GPUs.
then I ran the TF code mentioned above again , using NCCL, through Jupyter notebook remotely . it is still hanging
Epoch 1/20
INFO:tensorflow:batch_all_reduce: 6 all-reduces with algorithm = nccl, num_packs = 1
INFO:tensorflow:Reduce to /job:localhost/replica:0/task:0/device:CPU:0 then broadcast to ('/job:localhost/replica:0/task:0/device:CPU:0',).
INFO:tensorflow:batch_all_reduce: 6 all-reduces with algorithm = nccl, num_packs = 1
INFO:tensorflow:Reduce to /job:localhost/replica:0/task:0/device:CPU:0 then broadcast to ('/job:localhost/replica:0/task:0/device:CPU:0',).
From the tests above, we can conclude, when NCCL-TEST running, it blocks the nvidia-smi command, NCCL may be the root cause ,when TF calls NCCL, and calls some other GPU API like CUDA, it is blocked by NCCL, and TF is waiting CUDA to return like forever.
The first thing I'd try is to turn persistent mode on (nvidia-smi -pm 1
). Then run again the NCCL tests and see if you still see any hang with nvidia-smi.
Also it's quite surprising to see NCCL tests run fine while TF hangs. Could you try setting NCCL_MAX_NCHANNELS=1
and see if the hang still happens ? This will probably make performance worse but might help us understand what's happening.
I tested these test cases:
I turned on persistent mode: nvidia-smi -pm 1 I set the NCCL environment variables like this: NCCL_DEBUG=INFO NCCL_MAX_NCHANNELS=1 NCCL_P2P_DISABLE=0 NCCL_ALGO=Ring NCCL_IGNORE_CPU_AFFINITY=0 NCCL_NTHREADS=256 NCCL_DEBUG_SUBSYS=ALL
Then fire: "./all_reduce_perf -b 8 -e 128M -f 2 -g 2" result: it finished running after 15 mins, it is originally(with all default variables and pm = OFF) about 20-30 mins to return, and I don't know if it is too long??? the console showed these firstly after less than 1 minute:
./all_reduce_perf -b 8 -e 128M -f 2 -g 2
# nThread 1 nGpus 2 minBytes 8 maxBytes 134217728 step: 2(factor) warmup iters: 5 iters: 20 validation: 1
#
# Using devices
# Rank 0 Pid 5637 on wangying-system device 0 [0x01] GeForce RTX 2080 Ti
# Rank 1 Pid 5637 on wangying-system device 1 [0x02] GeForce RTX 2080 Ti
wangying-system:5637:5637 [0] NCCL INFO Bootstrap : Using [0]eno1:192.168.0.100<0>
wangying-system:5637:5637 [0] NCCL INFO NET/Plugin : No plugin found (libnccl-net.so), using internal implementation
wangying-system:5637:5637 [0] misc/ibvwrap.cc:63 NCCL WARN Failed to open libibverbs.so[.1]
wangying-system:5637:5637 [0] NCCL INFO NET/Socket : Using [0]eno1:192.168.0.100<0>
wangying-system:5637:5637 [0] NCCL INFO Using network Socket
NCCL version 2.6.4+cuda10.1
than showed these more after about 3-4 mins:
wangying-system:5637:5670 [0] NCCL INFO Topology detection : could not read /sys/devices/system/node/node-1/cpumap, ignoring
wangying-system:5637:5671 [1] NCCL INFO Topology detection : could not read /sys/devices/system/node/node-1/cpumap, ignoring
than after about 10 mins:
wangying-system:5637:5670 [0] NCCL INFO Topology detection : could not read /sys/devices/system/node/node-1/cpumap, ignoring
wangying-system:5637:5670 [0] NCCL INFO Topology detection : could not read /sys/devices/pci0000:00/0000:00:1f.6/max_link_speed, ignoring
wangying-system:5637:5670 [0] NCCL INFO Topology detection : could not read /sys/devices/pci0000:00/0000:00:1f.6/../max_link_speed, ignoring
wangying-system:5637:5670 [0] NCCL INFO Topology detection : could not read /sys/devices/pci0000:00/0000:00:1f.6/max_link_width, ignoring
wangying-system:5637:5670 [0] NCCL INFO Topology detection : could not read /sys/devices/pci0000:00/0000:00:1f.6/../max_link_width, ignoring
wangying-system:5637:5670 [0] NCCL INFO Topology detection : could not read /sys/devices/system/node/node-1/cpumap, ignoring
wangying-system:5637:5670 [0] NCCL INFO Attribute coll of node net not found
wangying-system:5637:5670 [0] NCCL INFO === System : maxWidth 21.0 ===
wangying-system:5637:5670 [0] NCCL INFO CPU/FFFFFFFFFFFFFFFF (1/1/2)
wangying-system:5637:5670 [0] NCCL INFO + PCI[12.0] - NIC/1F0
wangying-system:5637:5670 [0] NCCL INFO + PCI[6.0] - GPU/1000 (0)
wangying-system:5637:5670 [0] NCCL INFO + NVL[21.0] - GPU/2000
wangying-system:5637:5670 [0] NCCL INFO + PCI[6.0] - GPU/2000 (1)
wangying-system:5637:5670 [0] NCCL INFO + NVL[21.0] - GPU/1000
wangying-system:5637:5670 [0] NCCL INFO ==========================================
wangying-system:5637:5670 [0] NCCL INFO GPU/1000 :GPU/1000 (0/5000.000000/LOC) GPU/2000 (1/21.000000/NVL) CPU/FFFFFFFFFFFFFFFF (1/6.000000/PHB)
wangying-system:5637:5670 [0] NCCL INFO GPU/2000 :GPU/1000 (1/21.000000/NVL) GPU/2000 (0/5000.000000/LOC) CPU/FFFFFFFFFFFFFFFF (1/6.000000/PHB)
wangying-system:5637:5670 [0] NCCL INFO Pattern 4, crossNic 0, nChannels 1, speed 21.000000/21.000000, type NVL/PIX, sameChannels 1
wangying-system:5637:5670 [0] NCCL INFO 0 : GPU/0 GPU/1
wangying-system:5637:5670 [0] NCCL INFO Pattern 2, crossNic 0, nChannels 1, speed 21.000000/21.000000, type NVL/PIX, sameChannels 1
wangying-system:5637:5670 [0] NCCL INFO 0 : GPU/0 GPU/1
wangying-system:5637:5670 [0] NCCL INFO Pattern 3, crossNic 0, nChannels 1, speed 21.000000/21.000000, type NVL/PIX, sameChannels 1
wangying-system:5637:5670 [0] NCCL INFO 0 : GPU/0 GPU/1
wangying-system:5637:5671 [1] NCCL INFO Topology detection : could not read /sys/devices/system/node/node-1/cpumap, ignoring
wangying-system:5637:5671 [1] NCCL INFO Topology detection : could not read /sys/devices/pci0000:00/0000:00:1f.6/max_link_speed, ignoring
wangying-system:5637:5671 [1] NCCL INFO Topology detection : could not read /sys/devices/pci0000:00/0000:00:1f.6/../max_link_speed, ignoring
wangying-system:5637:5671 [1] NCCL INFO Topology detection : could not read /sys/devices/pci0000:00/0000:00:1f.6/max_link_width, ignoring
wangying-system:5637:5671 [1] NCCL INFO Topology detection : could not read /sys/devices/pci0000:00/0000:00:1f.6/../max_link_width, ignoring
wangying-system:5637:5671 [1] NCCL INFO Topology detection : could not read /sys/devices/system/node/node-1/cpumap, ignoring
wangying-system:5637:5671 [1] NCCL INFO Attribute coll of node net not found
wangying-system:5637:5671 [1] NCCL INFO === System : maxWidth 21.0 ===
wangying-system:5637:5671 [1] NCCL INFO CPU/FFFFFFFFFFFFFFFF (1/1/2)
wangying-system:5637:5671 [1] NCCL INFO + PCI[12.0] - NIC/1F0
wangying-system:5637:5671 [1] NCCL INFO + PCI[6.0] - GPU/1000 (0)
wangying-system:5637:5671 [1] NCCL INFO + NVL[21.0] - GPU/2000
wangying-system:5637:5671 [1] NCCL INFO + PCI[6.0] - GPU/2000 (1)
wangying-system:5637:5671 [1] NCCL INFO + NVL[21.0] - GPU/1000
wangying-system:5637:5671 [1] NCCL INFO ==========================================
wangying-system:5637:5671 [1] NCCL INFO GPU/1000 :GPU/1000 (0/5000.000000/LOC) GPU/2000 (1/21.000000/NVL) CPU/FFFFFFFFFFFFFFFF (1/6.000000/PHB)
wangying-system:5637:5671 [1] NCCL INFO GPU/2000 :GPU/1000 (1/21.000000/NVL) GPU/2000 (0/5000.000000/LOC) CPU/FFFFFFFFFFFFFFFF (1/6.000000/PHB)
wangying-system:5637:5671 [1] NCCL INFO Pattern 4, crossNic 0, nChannels 1, speed 21.000000/21.000000, type NVL/PIX, sameChannels 1
wangying-system:5637:5671 [1] NCCL INFO 0 : GPU/0 GPU/1
wangying-system:5637:5671 [1] NCCL INFO Pattern 2, crossNic 0, nChannels 1, speed 21.000000/21.000000, type NVL/PIX, sameChannels 1
wangying-system:5637:5671 [1] NCCL INFO 0 : GPU/0 GPU/1
wangying-system:5637:5671 [1] NCCL INFO Pattern 3, crossNic 0, nChannels 1, speed 21.000000/21.000000, type NVL/PIX, sameChannels 1
wangying-system:5637:5671 [1] NCCL INFO 0 : GPU/0 GPU/1
wangying-system:5637:5671 [1] NCCL INFO NCCL_MAX_NCHANNELS set by environment to 1.
wangying-system:5637:5671 [1] NCCL INFO NCCL_NTHREADS set by environment to 256.
wangying-system:5637:5670 [0] NCCL INFO Channel 00/01 : 0 1
wangying-system:5637:5671 [1] NCCL INFO threadThresholds 8/8/64 | 16/8/64 | 8/8/64
wangying-system:5637:5670 [0] NCCL INFO Latency/AlgBw | Tree/ LL | Tree/ LL128 | Tree/Simple | Ring/ LL | Ring/ LL128 | Ring/Simple | CollNet/ LL | CollNet/ LL128 | CollNet/Simple |
wangying-system:5637:5671 [1] NCCL INFO Trees [0] -1/-1/-1->1->0|0->1->-1/-1/-1
wangying-system:5637:5670 [0] NCCL INFO Max NThreads | 256 | 640 | 256 | 256 | 640 | 256 | 256 | 640 | 256 |
wangying-system:5637:5671 [1] NCCL INFO NCCL_IGNORE_CPU_AFFINITY set by environment to 0.
wangying-system:5637:5670 [0] NCCL INFO Broadcast | 0.0/ 0.0 | 0.0/ 0.0 | 0.0/ 0.0 | 4.0/ 5.2 | 6.1/ 0.0 | 14.1/ 21.0 | 0.0/ 0.0 | 0.0/ 0.0 | 0.0/ 0.0 |
wangying-system:5637:5670 [0] NCCL INFO Reduce | 0.0/ 0.0 | 0.0/ 0.0 | 0.0/ 0.0 | 4.0/ 5.2 | 6.1/ 0.0 | 14.1/ 21.0 | 0.0/ 0.0 | 0.0/ 0.0 | 0.0/ 0.0 |
wangying-system:5637:5670 [0] NCCL INFO AllGather | 0.0/ 0.0 | 0.0/ 0.0 | 0.0/ 0.0 | 4.0/ 10.5 | 6.1/ 0.0 | 14.1/ 42.0 | 0.0/ 0.0 | 0.0/ 0.0 | 0.0/ 0.0 |
wangying-system:5637:5670 [0] NCCL INFO ReduceScatter | 0.0/ 0.0 | 0.0/ 0.0 | 0.0/ 0.0 | 4.0/ 10.5 | 6.1/ 0.0 | 14.1/ 42.0 | 0.0/ 0.0 | 0.0/ 0.0 | 0.0/ 0.0 |
wangying-system:5637:5670 [0] NCCL INFO AllReduce | 5.4/ 0.0 | 8.2/ 0.0 | 56.0/ 0.0 | 4.4/ 5.2 | 8.6/ 0.0 | 19.8/ 21.0 | 10.4/ 0.0 | 13.2/ 0.0 | 18.7/ 0.0 |
wangying-system:5637:5670 [0] NCCL INFO threadThresholds 8/8/64 | 16/8/64 | 8/8/64
wangying-system:5637:5670 [0] NCCL INFO Trees [0] 1/-1/-1->0->-1|-1->0->1/-1/-1
wangying-system:5637:5671 [1] NCCL INFO Ring 00 : 1[2000] -> 0[1000] via P2P/direct pointer
wangying-system:5637:5670 [0] NCCL INFO Ring 00 : 0[1000] -> 1[2000] via P2P/direct pointer
wangying-system:5637:5671 [1] NCCL INFO comm 0x7fcd7c000e00 rank 1 nranks 2 cudaDev 1 busId 2000 - Init COMPLETE
wangying-system:5637:5670 [0] NCCL INFO comm 0x7fcd71196170 rank 0 nranks 2 cudaDev 0 busId 1000 - Init COMPLETE
#
# out-of-place in-place
# size count type redop time algbw busbw error time algbw busbw error
# (B) (elements) (us) (GB/s) (GB/s) (us) (GB/s) (GB/s)
wangying-system:5637:5637 [0] NCCL INFO AllReduce: opCount 0 sendbuff 0x7fcdbe000000 recvbuff 0x7fcdb6000000 count 33554432 datatype 7 op 0 root 0 comm 0x7fcd71196170 [nranks=2] stream 0x558925d9ff80
wangying-system:5637:5637 [0] NCCL INFO AllReduce: opCount 0 sendbuff 0x7fcd96000000 recvbuff 0x7fcd8e000000 count 33554432 datatype 7 op 0 root 0 comm 0x7fcd7c000e00 [nranks=2] stream 0x558926518e00
wangying-system:5637:5637 [0] NCCL INFO Launch mode Group/CGMD
wangying-system:5637:5637 [0] NCCL INFO AllReduce: opCount 1 sendbuff 0x7fcdbe000000 recvbuff 0x7fcdb6000000 count 33554432 datatype 7 op 0 root 0 comm 0x7fcd71196170 [nranks=2] stream 0x558925d9ff80
.... ..... many lines like recvbuff.....................
the system still hangs, I can move mouse but cannot click anything. (the bw is ok , drops about 10%, still better than without P2P communication.)
the questions are : 1 why there are two topology discovery rounds??? 2 why NCCL detects node1 for cpu ? there is only one cpu in system. 3 why tree algorithm tuning shows, when I specified only Ring algorithm
Then I run TF code , it still hangs, and after 20mins ,I reboot, and editing the post here
Basically test case 1 again remotely, check if nvidia-smi blocked remotely.
results: 1) nvidia-smi blocked ,and this time ,I waited the NCCL tests finished, then nvidia-smi returned result after NCCL test finished:
Thu Jun 11 11:48:00 2020
+-----------------------------------------------------------------------------+
| NVIDIA-SMI 440.82 Driver Version: 440.82 CUDA Version: 10.2 |
|-------------------------------+----------------------+----------------------+
| GPU Name Persistence-M| Bus-Id Disp.A | Volatile Uncorr. ECC |
| Fan Temp Perf Pwr:Usage/Cap| Memory-Usage | GPU-Util Compute M. |
|===============================+======================+======================|
| 0 GeForce RTX 208... On | 00000000:01:00.0 Off | N/A |
| 0% 34C P8 18W / 260W | 578MiB / 11016MiB | 0% Default |
+-------------------------------+----------------------+----------------------+
| 1 GeForce RTX 208... On | 00000000:02:00.0 Off | N/A |
| 0% 35C P8 12W / 260W | 580MiB / 11019MiB | 0% Default |
+-------------------------------+----------------------+----------------------+
+-----------------------------------------------------------------------------+
| Processes: GPU Memory |
| GPU PID Type Process name Usage |
|=============================================================================|
| 0 1762 C ./all_reduce_perf 569MiB |
| 1 1762 C ./all_reduce_perf 579MiB |
+-----------------------------------------------------------------------------+
this shows ./all_reduce_perf blocks nvidia-smi to return.
2) simple code "print(2+4)" still not blocked. 3) TF code still hangs:
Epoch 1/2
INFO:tensorflow:batch_all_reduce: 6 all-reduces with algorithm = nccl, num_packs = 1
INFO:tensorflow:Reduce to /job:localhost/replica:0/task:0/device:CPU:0 then broadcast to ('/job:localhost/replica:0/task:0/device:CPU:0',).
INFO:tensorflow:batch_all_reduce: 6 all-reduces with algorithm = nccl, num_packs = 1
INFO:tensorflow:Reduce to /job:localhost/replica:0/task:0/device:CPU:0 then broadcast to ('/job:localhost/replica:0/task:0/device:CPU:0',).
but from the jupyter console, I found something : after start running the TF code, jupyter console is returning this before hanging:
"""
2020-06-11 11:51:38.062792: I tensorflow/stream_executor/platform/default/dso_loader.cc:44] Successfully opened dynamic library libcuda.so.1
[I 11:51:49.184 NotebookApp] Saving file at /Projects/projects_emotion/2GPUtest.ipynb
2020-06-11 11:52:10.157455: I tensorflow/stream_executor/cuda/cuda_gpu_executor.cc:981] successful NUMA node read from SysFS had negative value (-1), but there must be at least one NUMA node, so returning NUMA node zero
2020-06-11 11:52:10.157946: I tensorflow/core/common_runtime/gpu/gpu_device.cc:1561] Found device 0 with properties:
pciBusID: 0000:01:00.0 name: GeForce RTX 2080 Ti computeCapability: 7.5
coreClock: 1.59GHz coreCount: 68 deviceMemorySize: 10.76GiB deviceMemoryBandwidth: 573.69GiB/s
2020-06-11 11:52:10.158035: I tensorflow/stream_executor/cuda/cuda_gpu_executor.cc:981] successful NUMA node read from SysFS had negative value (-1), but there must be at least one NUMA node, so returning NUMA node zero
2020-06-11 11:52:10.158483: I tensorflow/core/common_runtime/gpu/gpu_device.cc:1561] Found device 1 with properties:
pciBusID: 0000:02:00.0 name: GeForce RTX 2080 Ti computeCapability: 7.5
coreClock: 1.59GHz coreCount: 68 deviceMemorySize: 10.76GiB deviceMemoryBandwidth: 573.69GiB/s
2020-06-11 11:52:10.158666: I tensorflow/stream_executor/platform/default/dso_loader.cc:44] Successfully opened dynamic library libcudart.so.10.1
2020-06-11 11:52:10.177880: I tensorflow/stream_executor/platform/default/dso_loader.cc:44] Successfully opened dynamic library libcublas.so.10
2020-06-11 11:52:10.189116: I tensorflow/stream_executor/platform/default/dso_loader.cc:44] Successfully opened dynamic library libcufft.so.10
2020-06-11 11:52:10.192011: I tensorflow/stream_executor/platform/default/dso_loader.cc:44] Successfully opened dynamic library libcurand.so.10
2020-06-11 11:52:10.212995: I tensorflow/stream_executor/platform/default/dso_loader.cc:44] Successfully opened dynamic library libcusolver.so.10
2020-06-11 11:52:10.217748: I tensorflow/stream_executor/platform/default/dso_loader.cc:44] Successfully opened dynamic library libcusparse.so.10
2020-06-11 11:52:10.268347: I tensorflow/stream_executor/platform/default/dso_loader.cc:44] Successfully opened dynamic library libcudnn.so.7
2020-06-11 11:52:10.268658: I tensorflow/stream_executor/cuda/cuda_gpu_executor.cc:981] successful NUMA node read from SysFS had negative value (-1), but there must be at least one NUMA node, so returning NUMA node zero
2020-06-11 11:52:10.270592: I tensorflow/stream_executor/cuda/cuda_gpu_executor.cc:981] successful NUMA node read from SysFS had negative value (-1), but there must be at least one NUMA node, so returning NUMA node zero
2020-06-11 11:52:10.272525: I tensorflow/stream_executor/cuda/cuda_gpu_executor.cc:981] successful NUMA node read from SysFS had negative value (-1), but there must be at least one NUMA node, so returning NUMA node zero
2020-06-11 11:52:10.274385: I tensorflow/stream_executor/cuda/cuda_gpu_executor.cc:981] successful NUMA node read from SysFS had negative value (-1), but there must be at least one NUMA node, so returning NUMA node zero
2020-06-11 11:52:10.276123: I tensorflow/core/common_runtime/gpu/gpu_device.cc:1703] Adding visible gpu devices: 0, 1
2020-06-11 11:52:10.302103: I tensorflow/core/platform/cpu_feature_guard.cc:143] Your CPU supports instructions that this TensorFlow binary was not compiled to use: AVX2 FMA
2020-06-11 11:52:10.331471: I tensorflow/core/platform/profile_utils/cpu_utils.cc:102] CPU Frequency: 2899885000 Hz
2020-06-11 11:52:10.332315: I tensorflow/compiler/xla/service/service.cc:168] XLA service 0x7f8b0c000b60 initialized for platform Host (this does not guarantee that XLA will be used). Devices:
2020-06-11 11:52:10.332379: I tensorflow/compiler/xla/service/service.cc:176] StreamExecutor device (0): Host, Default Version
2020-06-11 11:52:10.721908: I tensorflow/stream_executor/cuda/cuda_gpu_executor.cc:981] successful NUMA node read from SysFS had negative value (-1), but there must be at least one NUMA node, so returning NUMA node zero
2020-06-11 11:52:10.731219: I tensorflow/stream_executor/cuda/cuda_gpu_executor.cc:981] successful NUMA node read from SysFS had negative value (-1), but there must be at least one NUMA node, so returning NUMA node zero
2020-06-11 11:52:10.731791: I tensorflow/compiler/xla/service/service.cc:168] XLA service 0x5ae5ce0 initialized for platform CUDA (this does not guarantee that XLA will be used). Devices:
2020-06-11 11:52:10.731807: I tensorflow/compiler/xla/service/service.cc:176] StreamExecutor device (0): GeForce RTX 2080 Ti, Compute Capability 7.5
2020-06-11 11:52:10.731812: I tensorflow/compiler/xla/service/service.cc:176] StreamExecutor device (1): GeForce RTX 2080 Ti, Compute Capability 7.5
2020-06-11 11:52:10.732502: I tensorflow/stream_executor/cuda/cuda_gpu_executor.cc:981] successful NUMA node read from SysFS had negative value (-1), but there must be at least one NUMA node, so returning NUMA node zero
2020-06-11 11:52:10.732981: I tensorflow/core/common_runtime/gpu/gpu_device.cc:1561] Found device 0 with properties:
pciBusID: 0000:01:00.0 name: GeForce RTX 2080 Ti computeCapability: 7.5
coreClock: 1.59GHz coreCount: 68 deviceMemorySize: 10.76GiB deviceMemoryBandwidth: 573.69GiB/s
2020-06-11 11:52:10.733028: I tensorflow/stream_executor/cuda/cuda_gpu_executor.cc:981] successful NUMA node read from SysFS had negative value (-1), but there must be at least one NUMA node, so returning NUMA node zero
2020-06-11 11:52:10.733490: I tensorflow/core/common_runtime/gpu/gpu_device.cc:1561] Found device 1 with properties:
pciBusID: 0000:02:00.0 name: GeForce RTX 2080 Ti computeCapability: 7.5
coreClock: 1.59GHz coreCount: 68 deviceMemorySize: 10.76GiB deviceMemoryBandwidth: 573.69GiB/s
2020-06-11 11:52:10.733516: I tensorflow/stream_executor/platform/default/dso_loader.cc:44] Successfully opened dynamic library libcudart.so.10.1
2020-06-11 11:52:10.733528: I tensorflow/stream_executor/platform/default/dso_loader.cc:44] Successfully opened dynamic library libcublas.so.10
2020-06-11 11:52:10.733540: I tensorflow/stream_executor/platform/default/dso_loader.cc:44] Successfully opened dynamic library libcufft.so.10
2020-06-11 11:52:10.733551: I tensorflow/stream_executor/platform/default/dso_loader.cc:44] Successfully opened dynamic library libcurand.so.10
2020-06-11 11:52:10.733563: I tensorflow/stream_executor/platform/default/dso_loader.cc:44] Successfully opened dynamic library libcusolver.so.10
2020-06-11 11:52:10.733574: I tensorflow/stream_executor/platform/default/dso_loader.cc:44] Successfully opened dynamic library libcusparse.so.10
2020-06-11 11:52:10.733585: I tensorflow/stream_executor/platform/default/dso_loader.cc:44] Successfully opened dynamic library libcudnn.so.7
2020-06-11 11:52:10.733621: I tensorflow/stream_executor/cuda/cuda_gpu_executor.cc:981] successful NUMA node read from SysFS had negative value (-1), but there must be at least one NUMA node, so returning NUMA node zero
2020-06-11 11:52:10.734107: I tensorflow/stream_executor/cuda/cuda_gpu_executor.cc:981] successful NUMA node read from SysFS had negative value (-1), but there must be at least one NUMA node, so returning NUMA node zero
2020-06-11 11:52:10.734594: I tensorflow/stream_executor/cuda/cuda_gpu_executor.cc:981] successful NUMA node read from SysFS had negative value (-1), but there must be at least one NUMA node, so returning NUMA node zero
2020-06-11 11:52:10.735081: I tensorflow/stream_executor/cuda/cuda_gpu_executor.cc:981] successful NUMA node read from SysFS had negative value (-1), but there must be at least one NUMA node, so returning NUMA node zero
2020-06-11 11:52:10.735539: I tensorflow/core/common_runtime/gpu/gpu_device.cc:1703] Adding visible gpu devices: 0, 1
2020-06-11 11:52:10.735774: I tensorflow/stream_executor/platform/default/dso_loader.cc:44] Successfully opened dynamic library libcudart.so.10.1
2020-06-11 11:52:10.736833: I tensorflow/core/common_runtime/gpu/gpu_device.cc:1102] Device interconnect StreamExecutor with strength 1 edge matrix:
2020-06-11 11:52:10.736845: I tensorflow/core/common_runtime/gpu/gpu_device.cc:1108] 0 1
2020-06-11 11:52:10.736852: I tensorflow/core/common_runtime/gpu/gpu_device.cc:1121] 0: N Y
2020-06-11 11:52:10.736856: I tensorflow/core/common_runtime/gpu/gpu_device.cc:1121] 1: Y N
2020-06-11 11:52:10.737195: I tensorflow/stream_executor/cuda/cuda_gpu_executor.cc:981] successful NUMA node read from SysFS had negative value (-1), but there must be at least one NUMA node, so returning NUMA node zero
2020-06-11 11:52:10.737690: I tensorflow/stream_executor/cuda/cuda_gpu_executor.cc:981] successful NUMA node read from SysFS had negative value (-1), but there must be at least one NUMA node, so returning NUMA node zero
2020-06-11 11:52:10.738180: I tensorflow/stream_executor/cuda/cuda_gpu_executor.cc:981] successful NUMA node read from SysFS had negative value (-1), but there must be at least one NUMA node, so returning NUMA node zero
2020-06-11 11:52:10.738649: I tensorflow/core/common_runtime/gpu/gpu_device.cc:1247] Created TensorFlow device (/job:localhost/replica:0/task:0/device:GPU:0 with 10201 MB memory) -> physical GPU (device: 0, name: GeForce RTX 2080 Ti, pci bus id: 0000:01:00.0, compute capability: 7.5)
2020-06-11 11:52:10.739231: I tensorflow/stream_executor/cuda/cuda_gpu_executor.cc:981] successful NUMA node read from SysFS had negative value (-1), but there must be at least one NUMA node, so returning NUMA node zero
2020-06-11 11:52:10.739710: I tensorflow/core/common_runtime/gpu/gpu_device.cc:1247] Created TensorFlow device (/job:localhost/replica:0/task:0/device:GPU:1 with 10203 MB memory) -> physical GPU (device: 1, name: GeForce RTX 2080 Ti, pci bus id: 0000:02:00.0, compute capability: 7.5)
2020-06-11 11:52:12.123844: I tensorflow/core/profiler/lib/profiler_session.cc:159] Profiler session started.
2020-06-11 11:52:12.124277: I tensorflow/core/profiler/internal/gpu/cupti_tracer.cc:1363] Profiler found 2 GPUs
2020-06-11 11:52:12.128452: I tensorflow/stream_executor/platform/default/dso_loader.cc:44] Successfully opened dynamic library libcupti.so.10.1
2020-06-11 11:52:12.229408: E tensorflow/core/profiler/internal/gpu/cupti_tracer.cc:1408] function cupti_interface_->Subscribe( &subscriber_, (CUpti_CallbackFunc)ApiCallback, this)failed with error CUPTI_ERROR_INSUFFICIENT_PRIVILEGES
2020-06-11 11:52:12.231351: E tensorflow/core/profiler/internal/gpu/cupti_tracer.cc:1447] function cupti_interface_->ActivityRegisterCallbacks( AllocCuptiActivityBuffer, FreeCuptiActivityBuffer)failed with error CUPTI_ERROR_INSUFFICIENT_PRIVILEGES
2020-06-11 11:52:12.231641: E tensorflow/core/profiler/internal/gpu/cupti_tracer.cc:1430] function cupti_interface_->EnableCallback( 0 , subscriber_, CUPTI_CB_DOMAIN_DRIVER_API, cbid)failed with error CUPTI_ERROR_INVALID_PARAMETER
2020-06-11 11:52:13.036926: I tensorflow/stream_executor/platform/default/dso_loader.cc:44] Successfully opened dynamic library libcublas.so.10
2020-06-11 11:52:13.649714: I tensorflow/stream_executor/platform/default/dso_loader.cc:44] Successfully opened dynamic library libcudnn.so.7
wangying-system:2441:2494 [1] NCCL INFO Bootstrap : Using [0]wlx90e6ba5a46fa:192.168.31.167<0>
wangying-system:2441:2494 [1] NCCL INFO NET/Plugin : No plugin found (libnccl-net.so), using internal implementation
wangying-system:2441:2494 [1] external/nccl_archive/src/misc/ibvwrap.cc:63 NCCL WARN Failed to open libibverbs.so[.1]
wangying-system:2441:2494 [1] NCCL INFO NET/Socket : Using [0]wlx90e6ba5a46fa:192.168.31.167<0>
NCCL version 2.5.7+cudaCUDA_MAJOR.CUDA_MINOR
wangying-system:2441:2569 [1] NCCL INFO NCCL_IGNORE_CPU_AFFINITY set by environment to 0.
wangying-system:2441:2569 [1] NCCL INFO Setting affinity for GPU 1 to 3f
wangying-system:2441:2568 [0] NCCL INFO Setting affinity for GPU 0 to 3f
"""
it shows TF is calling NCCL version 2.5.7+cudaCUDA_MAJOR.CUDA_MINOR, I only download NCCL once for 2.6.4, and where is this 2.5.7 come from??? and each time I run NCCL-TEST ,it shows NCCL version 2.6.4
I was editing post, and leave it hanging after about 30 mins, the TF CODE finished running !!!!
the jupyter cosole returned more after information above:
wangying-system:2441:2568 [0] NCCL INFO Intel CPU (PCI 12, InterCpu 8)
wangying-system:2441:2568 [0] NCCL INFO /sys/devices/pci0000:00/0000:00:14.0/usb1/1-12/1-12:1.0 -> 0/0/0/0
wangying-system:2441:2568 [0] NCCL INFO NCCL_P2P_DISABLE set by environment to 0.
wangying-system:2441:2568 [0] NCCL INFO === System : maxWidth 21 maxSpeed 21 ===
wangying-system:2441:2568 [0] NCCL INFO CPU/FFFFFFFFFFFFFFFF
wangying-system:2441:2568 [0] NCCL INFO + PCI[12] - GPU/1000 (0)
wangying-system:2441:2568 [0] NCCL INFO + NVL[21] - GPU/2000
wangying-system:2441:2568 [0] NCCL INFO + PCI[12] - GPU/2000 (1)
wangying-system:2441:2568 [0] NCCL INFO + NVL[21] - GPU/1000
wangying-system:2441:2568 [0] NCCL INFO + PCI[12] - PCI/0
wangying-system:2441:2568 [0] NCCL INFO + PCI[12] - NIC/0
wangying-system:2441:2568 [0] NCCL INFO ==========================================
wangying-system:2441:2568 [0] NCCL INFO GPU/1000 :GPU/1000 (0/5000/0) GPU/2000 (1/21/1) CPU/FFFFFFFFFFFFFFFF (1/12/2)
wangying-system:2441:2568 [0] NCCL INFO GPU/2000 :GPU/1000 (1/21/1) GPU/2000 (0/5000/0) CPU/FFFFFFFFFFFFFFFF (1/12/2)
wangying-system:2441:2568 [0] NCCL INFO Pattern 2, crossNic 0, nChannels 1, speed 21/21, nvlink 1, type 1, sameChannels 1
wangying-system:2441:2568 [0] NCCL INFO 0 : GPU/0 GPU/1
wangying-system:2441:2568 [0] NCCL INFO Pattern 4, crossNic 0, nChannels 1, speed 21/21, nvlink 1, type 1, sameChannels 1
wangying-system:2441:2568 [0] NCCL INFO 0 : GPU/0 GPU/1
wangying-system:2441:2569 [1] NCCL INFO /sys/devices/pci0000:00/0000:00:14.0/usb1/1-12/1-12:1.0 -> 0/0/0/0
wangying-system:2441:2569 [1] NCCL INFO === System : maxWidth 21 maxSpeed 21 ===
wangying-system:2441:2569 [1] NCCL INFO CPU/FFFFFFFFFFFFFFFF
wangying-system:2441:2569 [1] NCCL INFO + PCI[12] - GPU/1000 (0)
wangying-system:2441:2569 [1] NCCL INFO + NVL[21] - GPU/2000
wangying-system:2441:2569 [1] NCCL INFO + PCI[12] - GPU/2000 (1)
wangying-system:2441:2569 [1] NCCL INFO + NVL[21] - GPU/1000
wangying-system:2441:2569 [1] NCCL INFO + PCI[12] - PCI/0
wangying-system:2441:2569 [1] NCCL INFO + PCI[12] - NIC/0
wangying-system:2441:2569 [1] NCCL INFO ==========================================
wangying-system:2441:2569 [1] NCCL INFO GPU/1000 :GPU/1000 (0/5000/0) GPU/2000 (1/21/1) CPU/FFFFFFFFFFFFFFFF (1/12/2)
wangying-system:2441:2569 [1] NCCL INFO GPU/2000 :GPU/1000 (1/21/1) GPU/2000 (0/5000/0) CPU/FFFFFFFFFFFFFFFF (1/12/2)
wangying-system:2441:2569 [1] NCCL INFO Pattern 2, crossNic 0, nChannels 1, speed 21/21, nvlink 1, type 1, sameChannels 1
wangying-system:2441:2569 [1] NCCL INFO 0 : GPU/0 GPU/1
wangying-system:2441:2569 [1] NCCL INFO Pattern 4, crossNic 0, nChannels 1, speed 21/21, nvlink 1, type 1, sameChannels 1
wangying-system:2441:2569 [1] NCCL INFO 0 : GPU/0 GPU/1
wangying-system:2441:2569 [1] NCCL INFO NCCL_MAX_NCHANNELS set by environment to 1.
wangying-system:2441:2569 [1] NCCL INFO NCCL_NTHREADS set by environment to 256.
wangying-system:2441:2569 [1] NCCL INFO Threads per block : 256/640/256
wangying-system:2441:2568 [0] NCCL INFO Channel 00/01 : 0 1
wangying-system:2441:2569 [1] NCCL INFO threadThresholds 8/8/64 | 16/8/64
wangying-system:2441:2568 [0] NCCL INFO Threads per block : 256/640/256
wangying-system:2441:2569 [1] NCCL INFO Trees [0] -1/-1/-1->1->0|0->1->-1/-1/-1
wangying-system:2441:2568 [0] NCCL INFO Latency/AlgBw | Tree/ LL | Tree/ LL128 | Tree/Simple | Ring/ LL | Ring/ LL128 | Ring/Simple |
wangying-system:2441:2568 [0] NCCL INFO Broadcast | 0.0/ 0.0| 0.0/ 0.0| 0.0/ 0.0| 4.0/ 5.2| 6.1/ 0.0| 14.1/ 21.0|
wangying-system:2441:2568 [0] NCCL INFO Reduce | 0.0/ 0.0| 0.0/ 0.0| 0.0/ 0.0| 4.0/ 5.2| 6.1/ 0.0| 14.1/ 21.0|
wangying-system:2441:2568 [0] NCCL INFO AllGather | 0.0/ 0.0| 0.0/ 0.0| 0.0/ 0.0| 4.0/ 10.5| 6.1/ 0.0| 14.1/ 42.0|
wangying-system:2441:2568 [0] NCCL INFO ReduceScatter | 0.0/ 0.0| 0.0/ 0.0| 0.0/ 0.0| 4.0/ 10.5| 6.1/ 0.0| 14.1/ 42.0|
wangying-system:2441:2568 [0] NCCL INFO AllReduce | 5.4/ 0.0| 8.2/ 0.0| 56.0/ 0.0| 4.4/ 5.2| 8.6/ 0.0| 19.8/ 21.0|
wangying-system:2441:2568 [0] NCCL INFO threadThresholds 8/8/64 | 16/8/64
wangying-system:2441:2568 [0] NCCL INFO Trees [0] 1/-1/-1->0->-1|-1->0->1/-1/-1
wangying-system:2441:2569 [1] NCCL INFO Ring 00 : 1[2000] -> 0[1000] via P2P/direct pointer
wangying-system:2441:2568 [0] NCCL INFO Ring 00 : 0[1000] -> 1[2000] via P2P/direct pointer
wangying-system:2441:2569 [1] NCCL INFO comm 0x7f8a5c0aa760 rank 1 nranks 2 cudaDev 1 busId 2000 - Init COMPLETE
wangying-system:2441:2568 [0] NCCL INFO comm 0x7f8a582d31f0 rank 0 nranks 2 cudaDev 0 busId 1000 - Init COMPLETE
wangying-system:2441:2565 [0] NCCL INFO AllReduce: opCount 0 sendbuff 0x7f8a80c00000 recvbuff 0x7f8a80c00000 count 347146 datatype 7 op 0 root 0 comm 0x7f8a582d31f0 [nranks=2] stream 0x7f898f832140
wangying-system:2441:2565 [0] NCCL INFO Launch mode Group/CGMD
wangying-system:2441:2566 [1] NCCL INFO AllReduce: opCount 0 sendbuff 0x7f8a816a4000 recvbuff 0x7f8a816a4000 count 347146 datatype 7 op 0 root 0 comm 0x7f8a5c0aa760 [nranks=2] stream 0x7f898f8443d0
2020-06-11 12:18:16.116142: I tensorflow/core/profiler/lib/profiler_session.cc:159] Profiler session started.
2020-06-11 12:18:16.116204: E tensorflow/core/profiler/internal/gpu/cupti_tracer.cc:1408] function cupti_interface_->Subscribe( &subscriber_, (CUpti_CallbackFunc)ApiCallback, this)failed with error CUPTI_ERROR_NOT_INITIALIZED
2020-06-11 12:18:16.116223: E tensorflow/core/profiler/internal/gpu/cupti_tracer.cc:1447] function cupti_interface_->ActivityRegisterCallbacks( AllocCuptiActivityBuffer, FreeCuptiActivityBuffer)failed with error CUPTI_ERROR_NOT_INITIALIZED
wangying-system:2441:2565 [0] NCCL INFO AllReduce: opCount 1 sendbuff 0x7f8a80c00000 recvbuff 0x7f8a80c00000 count 347146 datatype 7 op 0 root 0 comm 0x7f8a582d31f0 [nranks=2] stream 0x7f898f832140
wangying-system:2441:2566 [1] NCCL INFO AllReduce: opCount 1 sendbuff 0x7f8a816a4000 recvbuff 0x7f8a816a4000 count 347146 datatype 7 op 0 root 0 comm 0x7f8a5c0aa760 [nranks=2] stream 0x7f898f8443d0
2020-06-11 12:18:16.122365: E tensorflow/core/profiler/internal/gpu/cupti_tracer.cc:1430] function cupti_interface_->EnableCallback( 0 , subscriber_, CUPTI_CB_DOMAIN_DRIVER_API, cbid)failed with error CUPTI_ERROR_INVALID_PARAMETER
2020-06-11 12:18:16.123972: I tensorflow/core/profiler/internal/gpu/device_tracer.cc:216] GpuTracer has collected 0 callback api events and 0 activity events.
2020-06-11 12:18:16.130630: I tensorflow/core/profiler/rpc/client/save_profile.cc:168] Creating directory: ./logs/train/plugins/profile/2020_06_11_12_18_16
2020-06-11 12:18:16.134600: I tensorflow/core/profiler/rpc/client/save_profile.cc:174] Dumped gzipped tool data for trace.json.gz to ./logs/train/plugins/profile/2020_06_11_12_18_16/wangying-system.trace.json.gz
2020-06-11 12:18:16.136308: I tensorflow/core/profiler/utils/event_span.cc:288] Generation of step-events took 0 ms
2020-06-11 12:18:16.136868: I tensorflow/python/profiler/internal/profiler_wrapper.cc:87] Creating directory: ./logs/train/plugins/profile/2020_06_11_12_18_16Dumped tool data for overview_page.pb to ./logs/train/plugins/profile/2020_06_11_12_18_16/wangying-system.overview_page.pb
Dumped tool data for input_pipeline.pb to ./logs/train/plugins/profile/2020_06_11_12_18_16/wangying-system.input_pipeline.pb
Dumped tool data for tensorflow_stats.pb to ./logs/train/plugins/profile/2020_06_11_12_18_16/wangying-system.tensorflow_stats.pb
Dumped tool data for kernel_stats.pb to ./logs/train/plugins/profile/2020_06_11_12_18_16/wangying-system.kernel_stats.pb
.. many many lines about .recv buff,.....
the jupyter web returns:
Epoch 1/2
INFO:tensorflow:batch_all_reduce: 6 all-reduces with algorithm = nccl, num_packs = 1
INFO:tensorflow:Reduce to /job:localhost/replica:0/task:0/device:CPU:0 then broadcast to ('/job:localhost/replica:0/task:0/device:CPU:0',).
INFO:tensorflow:batch_all_reduce: 6 all-reduces with algorithm = nccl, num_packs = 1
INFO:tensorflow:Reduce to /job:localhost/replica:0/task:0/device:CPU:0 then broadcast to ('/job:localhost/replica:0/task:0/device:CPU:0',).
468/469 [============================>.] - ETA: 0s - loss: 0.2585 - accuracy: 0.9256
Learning rate for epoch 1 is 0.0010000000474974513
469/469 [==============================] - 2s 5ms/step - loss: 0.2584 - accuracy: 0.9257 - lr: 0.0010
Epoch 2/2
469/469 [==============================] - ETA: 0s - loss: 0.0865 - accuracy: 0.9742
Learning rate for epoch 2 is 0.0010000000474974513
469/469 [==============================] - 1s 3ms/step - loss: 0.0865 - accuracy: 0.9742 - lr: 0.0010
Which is successfully finished as expected, but should be finished less than 30 seconds, not about 30 mins why it took so long????
From the two test case above , there are these questions: 0 Why it took 30 mins for TF to run with NCCL, while the same code runs less than 30 seconds without NCCL. 1 why would NCCL do a topology discovery every time it starts? it is like Windows doing a disk-scan every time I start playing minesweeper. 2 why the TF calls NCCL 2.5.7, while NCCL-TEST calls 2.6.4 3 why there are two topology discovery rounds??? I think nowadays all direct physical links inside computer/communication systems are full duplex , so the topology must be a un-directed graph , maybe acyclic or not , one discovery is good enough. even if GPUs are not connected in anyway , users should be warned, not to start NCCL at all. 4 why NCCL detects node1 for cpu ? there is only one cpu in system. 5 why tree algorithm tuning shows, when I specified only Ring algorithm
After all ,it is not clear to use NVLINK BRIDGE, MUST one use NCCL? since I ran CUDA utility test, it shows great speed between 2 GPUs, and NCCL uses CUDA kernels to perform inter-GPU communication and if I use "reduce to one device strategy, can I get the benefit using NVLINK??
I run the TF code again locally to capture full TF log to show TIME STAMPS. It took 26 mins from NCCL being called for the first time (20:08:36 ) to NCCL Initialization complete ( 20:34:39 )
[I 20:07:56.656 NotebookApp] Starting buffering for 2bb107c1-a1d3-4591-afe6-8a25e7f8b1eb:b9eeb086908244df81556b35a197df74
[I 20:07:56.862 NotebookApp] Kernel restarted: 2bb107c1-a1d3-4591-afe6-8a25e7f8b1eb
[I 20:07:57.223 NotebookApp] Restoring connection for 2bb107c1-a1d3-4591-afe6-8a25e7f8b1eb:b9eeb086908244df81556b35a197df74
[I 20:07:57.223 NotebookApp] Replaying 6 buffered messages
2020-06-11 20:07:59.162870: I tensorflow/stream_executor/platform/default/dso_loader.cc:44] Successfully opened dynamic library libcuda.so.1
2020-06-11 20:08:31.226164: I tensorflow/stream_executor/cuda/cuda_gpu_executor.cc:981] successful NUMA node read from SysFS had negative value (-1), but there must be at least one NUMA node, so returning NUMA node zero
2020-06-11 20:08:31.226618: I tensorflow/core/common_runtime/gpu/gpu_device.cc:1561] Found device 0 with properties:
pciBusID: 0000:01:00.0 name: GeForce RTX 2080 Ti computeCapability: 7.5
coreClock: 1.59GHz coreCount: 68 deviceMemorySize: 10.76GiB deviceMemoryBandwidth: 573.69GiB/s
2020-06-11 20:08:31.226666: I tensorflow/stream_executor/cuda/cuda_gpu_executor.cc:981] successful NUMA node read from SysFS had negative value (-1), but there must be at least one NUMA node, so returning NUMA node zero
2020-06-11 20:08:31.227050: I tensorflow/core/common_runtime/gpu/gpu_device.cc:1561] Found device 1 with properties:
pciBusID: 0000:02:00.0 name: GeForce RTX 2080 Ti computeCapability: 7.5
coreClock: 1.59GHz coreCount: 68 deviceMemorySize: 10.76GiB deviceMemoryBandwidth: 573.69GiB/s
2020-06-11 20:08:31.227193: I tensorflow/stream_executor/platform/default/dso_loader.cc:44] Successfully opened dynamic library libcudart.so.10.1
2020-06-11 20:08:31.245745: I tensorflow/stream_executor/platform/default/dso_loader.cc:44] Successfully opened dynamic library libcublas.so.10
2020-06-11 20:08:31.256383: I tensorflow/stream_executor/platform/default/dso_loader.cc:44] Successfully opened dynamic library libcufft.so.10
2020-06-11 20:08:31.258705: I tensorflow/stream_executor/platform/default/dso_loader.cc:44] Successfully opened dynamic library libcurand.so.10
2020-06-11 20:08:31.277503: I tensorflow/stream_executor/platform/default/dso_loader.cc:44] Successfully opened dynamic library libcusolver.so.10
2020-06-11 20:08:31.280465: I tensorflow/stream_executor/platform/default/dso_loader.cc:44] Successfully opened dynamic library libcusparse.so.10
2020-06-11 20:08:31.326590: I tensorflow/stream_executor/platform/default/dso_loader.cc:44] Successfully opened dynamic library libcudnn.so.7
2020-06-11 20:08:31.326900: I tensorflow/stream_executor/cuda/cuda_gpu_executor.cc:981] successful NUMA node read from SysFS had negative value (-1), but there must be at least one NUMA node, so returning NUMA node zero
2020-06-11 20:08:31.328778: I tensorflow/stream_executor/cuda/cuda_gpu_executor.cc:981] successful NUMA node read from SysFS had negative value (-1), but there must be at least one NUMA node, so returning NUMA node zero
2020-06-11 20:08:31.329402: I tensorflow/stream_executor/cuda/cuda_gpu_executor.cc:981] successful NUMA node read from SysFS had negative value (-1), but there must be at least one NUMA node, so returning NUMA node zero
2020-06-11 20:08:31.329837: I tensorflow/stream_executor/cuda/cuda_gpu_executor.cc:981] successful NUMA node read from SysFS had negative value (-1), but there must be at least one NUMA node, so returning NUMA node zero
2020-06-11 20:08:31.330253: I tensorflow/core/common_runtime/gpu/gpu_device.cc:1703] Adding visible gpu devices: 0, 1
2020-06-11 20:08:31.340112: I tensorflow/core/platform/cpu_feature_guard.cc:143] Your CPU supports instructions that this TensorFlow binary was not compiled to use: AVX2 FMA
2020-06-11 20:08:31.363991: I tensorflow/core/platform/profile_utils/cpu_utils.cc:102] CPU Frequency: 2899885000 Hz
2020-06-11 20:08:31.364279: I tensorflow/compiler/xla/service/service.cc:168] XLA service 0x7f6948000b60 initialized for platform Host (this does not guarantee that XLA will be used). Devices:
2020-06-11 20:08:31.364293: I tensorflow/compiler/xla/service/service.cc:176] StreamExecutor device (0): Host, Default Version
2020-06-11 20:08:31.544719: I tensorflow/stream_executor/cuda/cuda_gpu_executor.cc:981] successful NUMA node read from SysFS had negative value (-1), but there must be at least one NUMA node, so returning NUMA node zero
2020-06-11 20:08:31.553529: I tensorflow/stream_executor/cuda/cuda_gpu_executor.cc:981] successful NUMA node read from SysFS had negative value (-1), but there must be at least one NUMA node, so returning NUMA node zero
2020-06-11 20:08:31.553991: I tensorflow/compiler/xla/service/service.cc:168] XLA service 0x4936cb0 initialized for platform CUDA (this does not guarantee that XLA will be used). Devices:
2020-06-11 20:08:31.554006: I tensorflow/compiler/xla/service/service.cc:176] StreamExecutor device (0): GeForce RTX 2080 Ti, Compute Capability 7.5
2020-06-11 20:08:31.554011: I tensorflow/compiler/xla/service/service.cc:176] StreamExecutor device (1): GeForce RTX 2080 Ti, Compute Capability 7.5
2020-06-11 20:08:31.554559: I tensorflow/stream_executor/cuda/cuda_gpu_executor.cc:981] successful NUMA node read from SysFS had negative value (-1), but there must be at least one NUMA node, so returning NUMA node zero
2020-06-11 20:08:31.554944: I tensorflow/core/common_runtime/gpu/gpu_device.cc:1561] Found device 0 with properties:
pciBusID: 0000:01:00.0 name: GeForce RTX 2080 Ti computeCapability: 7.5
coreClock: 1.59GHz coreCount: 68 deviceMemorySize: 10.76GiB deviceMemoryBandwidth: 573.69GiB/s
2020-06-11 20:08:31.554990: I tensorflow/stream_executor/cuda/cuda_gpu_executor.cc:981] successful NUMA node read from SysFS had negative value (-1), but there must be at least one NUMA node, so returning NUMA node zero
2020-06-11 20:08:31.555362: I tensorflow/core/common_runtime/gpu/gpu_device.cc:1561] Found device 1 with properties:
pciBusID: 0000:02:00.0 name: GeForce RTX 2080 Ti computeCapability: 7.5
coreClock: 1.59GHz coreCount: 68 deviceMemorySize: 10.76GiB deviceMemoryBandwidth: 573.69GiB/s
2020-06-11 20:08:31.555392: I tensorflow/stream_executor/platform/default/dso_loader.cc:44] Successfully opened dynamic library libcudart.so.10.1
2020-06-11 20:08:31.555405: I tensorflow/stream_executor/platform/default/dso_loader.cc:44] Successfully opened dynamic library libcublas.so.10
2020-06-11 20:08:31.555416: I tensorflow/stream_executor/platform/default/dso_loader.cc:44] Successfully opened dynamic library libcufft.so.10
2020-06-11 20:08:31.555428: I tensorflow/stream_executor/platform/default/dso_loader.cc:44] Successfully opened dynamic library libcurand.so.10
2020-06-11 20:08:31.555440: I tensorflow/stream_executor/platform/default/dso_loader.cc:44] Successfully opened dynamic library libcusolver.so.10
2020-06-11 20:08:31.555451: I tensorflow/stream_executor/platform/default/dso_loader.cc:44] Successfully opened dynamic library libcusparse.so.10
2020-06-11 20:08:31.555464: I tensorflow/stream_executor/platform/default/dso_loader.cc:44] Successfully opened dynamic library libcudnn.so.7
2020-06-11 20:08:31.555502: I tensorflow/stream_executor/cuda/cuda_gpu_executor.cc:981] successful NUMA node read from SysFS had negative value (-1), but there must be at least one NUMA node, so returning NUMA node zero
2020-06-11 20:08:31.556281: I tensorflow/stream_executor/cuda/cuda_gpu_executor.cc:981] successful NUMA node read from SysFS had negative value (-1), but there must be at least one NUMA node, so returning NUMA node zero
2020-06-11 20:08:31.556757: I tensorflow/stream_executor/cuda/cuda_gpu_executor.cc:981] successful NUMA node read from SysFS had negative value (-1), but there must be at least one NUMA node, so returning NUMA node zero
2020-06-11 20:08:31.557163: I tensorflow/stream_executor/cuda/cuda_gpu_executor.cc:981] successful NUMA node read from SysFS had negative value (-1), but there must be at least one NUMA node, so returning NUMA node zero
2020-06-11 20:08:31.557532: I tensorflow/core/common_runtime/gpu/gpu_device.cc:1703] Adding visible gpu devices: 0, 1
2020-06-11 20:08:31.557755: I tensorflow/stream_executor/platform/default/dso_loader.cc:44] Successfully opened dynamic library libcudart.so.10.1
2020-06-11 20:08:31.558879: I tensorflow/core/common_runtime/gpu/gpu_device.cc:1102] Device interconnect StreamExecutor with strength 1 edge matrix:
2020-06-11 20:08:31.558894: I tensorflow/core/common_runtime/gpu/gpu_device.cc:1108] 0 1
2020-06-11 20:08:31.558899: I tensorflow/core/common_runtime/gpu/gpu_device.cc:1121] 0: N Y
2020-06-11 20:08:31.558903: I tensorflow/core/common_runtime/gpu/gpu_device.cc:1121] 1: Y N
2020-06-11 20:08:31.559222: I tensorflow/stream_executor/cuda/cuda_gpu_executor.cc:981] successful NUMA node read from SysFS had negative value (-1), but there must be at least one NUMA node, so returning NUMA node zero
2020-06-11 20:08:31.559632: I tensorflow/stream_executor/cuda/cuda_gpu_executor.cc:981] successful NUMA node read from SysFS had negative value (-1), but there must be at least one NUMA node, so returning NUMA node zero
2020-06-11 20:08:31.560041: I tensorflow/stream_executor/cuda/cuda_gpu_executor.cc:981] successful NUMA node read from SysFS had negative value (-1), but there must be at least one NUMA node, so returning NUMA node zero
2020-06-11 20:08:31.560425: I tensorflow/core/common_runtime/gpu/gpu_device.cc:1247] Created TensorFlow device (/job:localhost/replica:0/task:0/device:GPU:0 with 9974 MB memory) -> physical GPU (device: 0, name: GeForce RTX 2080 Ti, pci bus id: 0000:01:00.0, compute capability: 7.5)
2020-06-11 20:08:31.561006: I tensorflow/stream_executor/cuda/cuda_gpu_executor.cc:981] successful NUMA node read from SysFS had negative value (-1), but there must be at least one NUMA node, so returning NUMA node zero
2020-06-11 20:08:31.561396: I tensorflow/core/common_runtime/gpu/gpu_device.cc:1247] Created TensorFlow device (/job:localhost/replica:0/task:0/device:GPU:1 with 10202 MB memory) -> physical GPU (device: 1, name: GeForce RTX 2080 Ti, pci bus id: 0000:02:00.0, compute capability: 7.5)
2020-06-11 20:08:33.012283: I tensorflow/core/profiler/lib/profiler_session.cc:159] Profiler session started.
2020-06-11 20:08:33.012750: I tensorflow/core/profiler/internal/gpu/cupti_tracer.cc:1363] Profiler found 2 GPUs
2020-06-11 20:08:33.016798: I tensorflow/stream_executor/platform/default/dso_loader.cc:44] Successfully opened dynamic library libcupti.so.10.1
2020-06-11 20:08:33.117544: E tensorflow/core/profiler/internal/gpu/cupti_tracer.cc:1408] function cupti_interface_->Subscribe( &subscriber_, (CUpti_CallbackFunc)ApiCallback, this)failed with error CUPTI_ERROR_INSUFFICIENT_PRIVILEGES
2020-06-11 20:08:33.119155: E tensorflow/core/profiler/internal/gpu/cupti_tracer.cc:1447] function cupti_interface_->ActivityRegisterCallbacks( AllocCuptiActivityBuffer, FreeCuptiActivityBuffer)failed with error CUPTI_ERROR_INSUFFICIENT_PRIVILEGES
2020-06-11 20:08:33.119578: E tensorflow/core/profiler/internal/gpu/cupti_tracer.cc:1430] function cupti_interface_->EnableCallback( 0 , subscriber_, CUPTI_CB_DOMAIN_DRIVER_API, cbid)failed with error CUPTI_ERROR_INVALID_PARAMETER
2020-06-11 20:08:35.945095: I tensorflow/stream_executor/platform/default/dso_loader.cc:44] Successfully opened dynamic library libcublas.so.10
**2020-06-11 20:08:36.611558: I tensorflow/stream_executor/platform/default/dso_loader.cc:44] Successfully opened dynamic library libcudnn.so.7**
wangying-system:7436:7497 [0] NCCL INFO Bootstrap : Using [0]eno1:192.168.0.100<0>
wangying-system:7436:7497 [0] NCCL INFO NET/Plugin : No plugin found (libnccl-net.so), using internal implementation
wangying-system:7436:7497 [0] external/nccl_archive/src/misc/ibvwrap.cc:63 NCCL WARN Failed to open libibverbs.so[.1]
wangying-system:7436:7497 [0] NCCL INFO NET/Socket : Using [0]eno1:192.168.0.100<0>
NCCL version 2.5.7+cudaCUDA_MAJOR.CUDA_MINOR
wangying-system:7436:7593 [0] NCCL INFO NCCL_IGNORE_CPU_AFFINITY set by environment to 1.
wangying-system:7436:7593 [0] NCCL INFO Setting affinity for GPU 0 to 3f
wangying-system:7436:7594 [1] NCCL INFO Setting affinity for GPU 1 to 3f
[I 20:09:38.772 NotebookApp] Saving file at /Projects/projects_emotion/2GPUtest.ipynb
wangying-system:7436:7593 [0] NCCL INFO Intel CPU (PCI 12, InterCpu 8)
wangying-system:7436:7593 [0] NCCL INFO /sys/devices/pci0000:00/0000:00:1f.6 -> 0/0/0/0
wangying-system:7436:7593 [0] NCCL INFO NCCL_P2P_DISABLE set by environment to 0.
wangying-system:7436:7593 [0] NCCL INFO === System : maxWidth 21 maxSpeed 21 ===
wangying-system:7436:7593 [0] NCCL INFO CPU/FFFFFFFFFFFFFFFF
wangying-system:7436:7593 [0] NCCL INFO + PCI[12] - GPU/1000 (0)
wangying-system:7436:7593 [0] NCCL INFO + NVL[21] - GPU/2000
wangying-system:7436:7593 [0] NCCL INFO + PCI[12] - GPU/2000 (1)
wangying-system:7436:7593 [0] NCCL INFO + NVL[21] - GPU/1000
wangying-system:7436:7593 [0] NCCL INFO + PCI[12] - NIC/0
wangying-system:7436:7593 [0] NCCL INFO ==========================================
wangying-system:7436:7593 [0] NCCL INFO GPU/1000 :GPU/1000 (0/5000/0) GPU/2000 (1/21/1) CPU/FFFFFFFFFFFFFFFF (1/12/2)
wangying-system:7436:7593 [0] NCCL INFO GPU/2000 :GPU/1000 (1/21/1) GPU/2000 (0/5000/0) CPU/FFFFFFFFFFFFFFFF (1/12/2)
wangying-system:7436:7593 [0] NCCL INFO Pattern 2, crossNic 0, nChannels 1, speed 21/21, nvlink 1, type 1, sameChannels 1
wangying-system:7436:7593 [0] NCCL INFO 0 : GPU/0 GPU/1
wangying-system:7436:7593 [0] NCCL INFO Pattern 4, crossNic 0, nChannels 1, speed 21/21, nvlink 1, type 1, sameChannels 1
wangying-system:7436:7593 [0] NCCL INFO 0 : GPU/0 GPU/1
wangying-system:7436:7594 [1] NCCL INFO /sys/devices/pci0000:00/0000:00:1f.6 -> 0/0/0/0
wangying-system:7436:7594 [1] NCCL INFO === System : maxWidth 21 maxSpeed 21 ===
wangying-system:7436:7594 [1] NCCL INFO CPU/FFFFFFFFFFFFFFFF
wangying-system:7436:7594 [1] NCCL INFO + PCI[12] - GPU/1000 (0)
wangying-system:7436:7594 [1] NCCL INFO + NVL[21] - GPU/2000
wangying-system:7436:7594 [1] NCCL INFO + PCI[12] - GPU/2000 (1)
wangying-system:7436:7594 [1] NCCL INFO + NVL[21] - GPU/1000
wangying-system:7436:7594 [1] NCCL INFO + PCI[12] - NIC/0
wangying-system:7436:7594 [1] NCCL INFO ==========================================
wangying-system:7436:7594 [1] NCCL INFO GPU/1000 :GPU/1000 (0/5000/0) GPU/2000 (1/21/1) CPU/FFFFFFFFFFFFFFFF (1/12/2)
wangying-system:7436:7594 [1] NCCL INFO GPU/2000 :GPU/1000 (1/21/1) GPU/2000 (0/5000/0) CPU/FFFFFFFFFFFFFFFF (1/12/2)
wangying-system:7436:7594 [1] NCCL INFO Pattern 2, crossNic 0, nChannels 1, speed 21/21, nvlink 1, type 1, sameChannels 1
wangying-system:7436:7594 [1] NCCL INFO 0 : GPU/0 GPU/1
wangying-system:7436:7594 [1] NCCL INFO Pattern 4, crossNic 0, nChannels 1, speed 21/21, nvlink 1, type 1, sameChannels 1
wangying-system:7436:7594 [1] NCCL INFO 0 : GPU/0 GPU/1
wangying-system:7436:7593 [0] NCCL INFO NCCL_MAX_NCHANNELS set by environment to 1.
wangying-system:7436:7593 [0] NCCL INFO Channel 00/01 : 0 1
wangying-system:7436:7593 [0] NCCL INFO NCCL_NTHREADS set by environment to 256.
wangying-system:7436:7593 [0] NCCL INFO Threads per block : 256/640/256
wangying-system:7436:7593 [0] NCCL INFO Latency/AlgBw | Tree/ LL | Tree/ LL128 | Tree/Simple | Ring/ LL | Ring/ LL128 | Ring/Simple |
wangying-system:7436:7593 [0] NCCL INFO Broadcast | 0.0/ 0.0| 0.0/ 0.0| 0.0/ 0.0| 4.0/ 5.2| 6.1/ 0.0| 14.1/ 0.0|
wangying-system:7436:7593 [0] NCCL INFO Reduce | 0.0/ 0.0| 0.0/ 0.0| 0.0/ 0.0| 4.0/ 5.2| 6.1/ 0.0| 14.1/ 0.0|
wangying-system:7436:7593 [0] NCCL INFO AllGather | 0.0/ 0.0| 0.0/ 0.0| 0.0/ 0.0| 4.0/ 10.5| 6.1/ 0.0| 14.1/ 0.0|
wangying-system:7436:7593 [0] NCCL INFO ReduceScatter | 0.0/ 0.0| 0.0/ 0.0| 0.0/ 0.0| 4.0/ 10.5| 6.1/ 0.0| 14.1/ 0.0|
wangying-system:7436:7593 [0] NCCL INFO AllReduce | 5.4/ 0.0| 8.2/ 0.0| 56.0/ 0.0| 4.4/ 5.2| 8.6/ 0.0| 19.8/ 0.0|
wangying-system:7436:7593 [0] NCCL INFO threadThresholds 8/8/64 | 16/8/64
wangying-system:7436:7593 [0] NCCL INFO Trees [0] 1/-1/-1->0->-1|-1->0->1/-1/-1
wangying-system:7436:7594 [1] NCCL INFO Threads per block : 256/640/256
wangying-system:7436:7594 [1] NCCL INFO threadThresholds 8/8/64 | 16/8/64
wangying-system:7436:7594 [1] NCCL INFO Trees [0] -1/-1/-1->1->0|0->1->-1/-1/-1
wangying-system:7436:7594 [1] NCCL INFO Ring 00 : 1[2000] -> 0[1000] via P2P/direct pointer
wangying-system:7436:7593 [0] NCCL INFO Ring 00 : 0[1000] -> 1[2000] via P2P/direct pointer
wangying-system:7436:7593 [0] NCCL INFO comm 0x7f6924f08540 rank 0 nranks 2 cudaDev 0 busId 1000 - Init COMPLETE
wangying-system:7436:7594 [1] NCCL INFO comm 0x7f692000d240 rank 1 nranks 2 cudaDev 1 busId 2000 - Init COMPLETE
wangying-system:7436:7590 [0] NCCL INFO AllReduce: opCount 0 sendbuff 0x7f68b2c00000 recvbuff 0x7f68b2c00000 count 347146 datatype 7 op 0 root 0 comm 0x7f6924f08540 [nranks=2] stream 0x7f67ec093f90
wangying-system:7436:7591 [1] NCCL INFO AllReduce: opCount 0 sendbuff 0x7f68b36a4000 recvbuff 0x7f68b36a4000 count 347146 datatype 7 op 0 root 0 comm 0x7f692000d240 [nranks=2] stream 0x7f67ec0944b0
wangying-system:7436:7590 [0] NCCL INFO Launch mode Group/CGMD
**2020-06-11 20:34:39.023120: I tensorflow/core/profiler/lib/profiler_session.cc:159] Profiler session started.**
2020-06-11 20:34:39.023195: E tensorflow/core/profiler/internal/gpu/cupti_tracer.cc:1408] function cupti_interface_->Subscribe( &subscriber_, (CUpti_CallbackFunc)ApiCallback, this)failed with error CUPTI_ERROR_NOT_INITIALIZED
2020-06-11 20:34:39.023212: E tensorflow/core/profiler/internal/gpu/cupti_tracer.cc:1447] function cupti_interface_->ActivityRegisterCallbacks( AllocCuptiActivityBuffer, FreeCuptiActivityBuffer)failed with error CUPTI_ERROR_NOT_INITIALIZED
wangying-system:7436:7591 [1] NCCL INFO AllReduce: opCount 1 sendbuff 0x7f68b36a4000 recvbuff 0x7f68b36a4000 count 347146 datatype 7 op 0 root 0 comm 0x7f692000d240 [nranks=2] stream 0x7f67ec0944b0
wangying-system:7436:7590 [0] NCCL INFO AllReduce: opCount 1 sendbuff 0x7f68b2c00000 recvbuff 0x7f68b2c00000 count 347146 datatype 7 op 0 root 0 comm 0x7f6924f08540 [nranks=2] stream 0x7f67ec093f90
2020-06-11 20:34:39.035513: E tensorflow/core/profiler/internal/gpu/cupti_tracer.cc:1430] function cupti_interface_->EnableCallback( 0 , subscriber_, CUPTI_CB_DOMAIN_DRIVER_API, cbid)failed with error CUPTI_ERROR_INVALID_PARAMETER
2020-06-11 20:34:39.038820: I tensorflow/core/profiler/internal/gpu/device_tracer.cc:216] GpuTracer has collected 0 callback api events and 0 activity events.
2020-06-11 20:34:39.045918: I tensorflow/core/profiler/rpc/client/save_profile.cc:168] Creating directory: ./logs/train/plugins/profile/2020_06_11_20_34_39
2020-06-11 20:34:39.051031: I tensorflow/core/profiler/rpc/client/save_profile.cc:174] Dumped gzipped tool data for trace.json.gz to ./logs/train/plugins/profile/2020_06_11_20_34_39/wangying-system.trace.json.gz
2020-06-11 20:34:39.053236: I tensorflow/core/profiler/utils/event_span.cc:288] Generation of step-events took 0 ms
2020-06-11 20:34:39.053822: I tensorflow/python/profiler/internal/profiler_wrapper.cc:87] Creating directory: ./logs/train/plugins/profile/2020_06_11_20_34_39Dumped tool data for overview_page.pb to ./logs/train/plugins/profile/2020_06_11_20_34_39/wangying-system.overview_page.pb
Dumped tool data for input_pipeline.pb to ./logs/train/plugins/profile/2020_06_11_20_34_39/wangying-system.input_pipeline.pb
Dumped tool data for tensorflow_stats.pb to ./logs/train/plugins/profile/2020_06_11_20_34_39/wangying-system.tensorflow_stats.pb
Dumped tool data for kernel_stats.pb to ./logs/train/plugins/profile/2020_06_11_20_34_39/wangying-system.kernel_stats.pb
wangying-system:7436:7590 [0] NCCL INFO AllReduce: opCount 2 sendbuff 0x7f68b2c00000 recvbuff 0x7f68b2c00000 count 347146 datatype 7 op 0 root 0 comm 0x7f6924f08540 [nranks=2] stream 0x7f67ec093f90
wangying-system:7436:7591 [1] NCCL INFO AllReduce: opCount 2 sendbuff 0x7f68b36a4000 recvbuff 0x7f68b36a4000 count 347146 datatype 7 op 0 root 0 comm 0x7f692000d240 [nranks=2] stream 0x7f67ec0944b0
wangying-system:7436:7590 [0] NCCL INFO AllReduce: opCount 3 sendbuff 0x7f68b2c00000 recvbuff 0x7f68b2c00000 count 347146 datatype 7 op 0 root 0 comm 0x7f6924f08540 [nranks=2] stream 0x7f67ec093f90
....... skip many sendbuff and recvbuff lines...........
wangying-system:7436:7590 [0] NCCL INFO AllReduce: opCount 3a9 sendbuff 0x7f6861845800 recvbuff 0x7f6861845800 count 347146 datatype 7 op 0 root 0 comm 0x7f6924f08540 [nranks=2] stream 0x7f67ec093f90
wangying-system:7436:7591 [1] NCCL INFO AllReduce: opCount 3a9 sendbuff 0x7f68b36a4000 recvbuff 0x7f68b36a4000 count 347146 datatype 7 op 0 root 0 comm 0x7f692000d240 [nranks=2] stream 0x7f67ec0944b0
2020-06-11 20:34:45.313519: W tensorflow/python/util/util.cc:329] Sets are not currently considered sequences, but this may change in the future, so consider avoiding using them.
[I 20:36:38.845 NotebookApp] Saving file at /Projects/projects_emotion/2GPUtest.ipynb
I run NCCL-TEST again, after NCCL starts to discover topology ,right before system hangs , the task monitor shows this:
it is a typycal pattern that multi processes are using some blocking-queue model playing consumer and producer, and they are not really parallelized. one process is wating the other process. I think some other model like linkedBlockingQueue can be much faster and let them run concurrently.
Trying to answer all of your questions :
Let's remove the following environment variables moving forward (they should not be needed and could cause issues) :
NCCL_MAX_NCHANNELS=1
NCCL_P2P_DISABLE=0
NCCL_NTHREADS=256
Given the CPU usage shown here, I'm wondering whether CUDA would be recompiling NCCL every time, considering it doesn't have the support for your GPU architecture. Since you mentioned you are using NCCL 2.6.4, may I ask how you installed it ? Did you get binaries from developer.nvidia.com or did you recompile NCCL yourself ? If so, did you add any NVCC_GENCODE
option to your make
command ?
If that is indeed your problem, one solution could be to recompile NCCL adding NVCC_GENCODE=-gencode=arch=compute_75,code=sm_75
to the make command line. That should solve the problem with the NCCL tests. But that might not solve your problem with tensorflow as it is embedding its own version of NCCL. The other solution would be to make sure the code we recompile is cached (in ~/.nv/ComputeCache
) so that we only recompile it once. From the doc at https://docs.nvidia.com/cuda/cuda-c-programming-guide/index.html#env-vars, setting CUDA_CACHE_MAXSIZE=4294967296 CUDA_CACHE_DISABLE=0
should ensure that.
@sjeaugey Thanks a lot!!!! "How I install NCCL? " I got binaries from developer.nvidia.com
I went to a download page for NCCL 2.6.4 for CUDA 10.1(which is the highest supported version by TF2.2)
I download a package for Ubuntu 18.04 LTS(which is the closest to my 20.04LTS )
"nccl-repo-ubuntu1804-2.6.4-ga-cuda10.1_1-1_amd64.deb" 48.2MB
I ran sudo dpkg -i nccl-repo-ubuntu1804-2.6.4-ga-cuda10.1_1-1_amd64.deb
it showed decompress, copy and set something.
Then I ran TF code, which froze the system.
Then I go to the same download page again ,I downloaded the package for universal Linux: "nccl_2.6.4-1+cuda10.1_x86_64.txz" 45.2MB I decompressed it , copy the lib files and include files to CUDA 10.1's lib64 and include archives . Then I ran TF code, which froze the system again ,Then I submitted a bug at TF's github.
I check the ~/.nv/ComputeCache archive, it has an index file ,and 9 archives there, each archive have 2 archives and one file in them each. all file shows last modify date is 2020-5-28, which is the day I first ran it I think.
Thanks.
20.04 is not supported yet, so I'd like to make sure it's not caused by a weird 18.04/20.04 interaction.
Could you recompile NCCL and launch the perf test again :
# Get NCCL and build it
git clone https://github.com/NVIDIA/nccl
cd nccl
# Install g++-7 if not installed already
sudo apt install g++-7
make -j 8 test.build CXX=g++-7 NVCC_GENCODE=-gencode=arch=compute_75,code=sm_75
# Use the newly built library
export LD_LIBRARY_PATH=$PWD/build/lib:$LD_LIBRARY_PATH
# Run the tests again
cd /path/to/nccl-tests/build/
./all_reduce_perf -b 8 -e 128M -f 2 -g 2
I have delete everything inside ~/.nv/ComputeCache, then run nccl-test again, nothing generated in that archive I then run all the code above to build a NCCL 2.7.3, and all_reduce_perf, nothing generated in ~/.nv/ComputeCache archive either
it still takes 25 mins to finish, here is the result:
$./all_reduce_perf -b 8 -e 128M -f 2 -g 2
# nThread 1 nGpus 2 minBytes 8 maxBytes 134217728 step: 2(factor) warmup iters: 5 iters: 20 validation: 1
#
# Using devices
# Rank 0 Pid 12262 on wangying-system device 0 [0x01] GeForce RTX 2080 Ti
# Rank 1 Pid 12262 on wangying-system device 1 [0x02] GeForce RTX 2080 Ti
wangying-system:12262:12262 [0] NCCL INFO Bootstrap : Using [0]eno1:192.168.0.100<0>
wangying-system:12262:12262 [0] NCCL INFO NET/Plugin : No plugin found (libnccl-net.so), using internal implementation
wangying-system:12262:12262 [0] misc/ibvwrap.cc:63 NCCL WARN Failed to open libibverbs.so[.1]
wangying-system:12262:12262 [0] NCCL INFO NET/Socket : Using [0]eno1:192.168.0.100<0>
wangying-system:12262:12262 [0] NCCL INFO Using network Socket
NCCL version 2.7.3+cuda10.1
wangying-system:12262:12276 [1] NCCL INFO Topology detection : could not read /sys/devices/system/node/node-1/cpumap, ignoring
wangying-system:12262:12275 [0] NCCL INFO Topology detection : could not read /sys/devices/system/node/node-1/cpumap, ignoring
wangying-system:12262:12276 [1] NCCL INFO Topology detection : could not read /sys/devices/system/node/node-1/cpumap, ignoring
wangying-system:12262:12275 [0] NCCL INFO Topology detection : could not read /sys/devices/system/node/node-1/cpumap, ignoring
wangying-system:12262:12276 [1] NCCL INFO Topology detection : could not read /sys/devices/pci0000:00/0000:00:1f.6/max_link_speed, ignoring
wangying-system:12262:12276 [1] NCCL INFO Topology detection : could not read /sys/devices/pci0000:00/0000:00:1f.6/../max_link_speed, ignoring
wangying-system:12262:12276 [1] NCCL INFO Topology detection : could not read /sys/devices/pci0000:00/0000:00:1f.6/max_link_width, ignoring
wangying-system:12262:12276 [1] NCCL INFO Topology detection : could not read /sys/devices/pci0000:00/0000:00:1f.6/../max_link_width, ignoring
wangying-system:12262:12276 [1] NCCL INFO Topology detection : could not read /sys/devices/system/node/node-1/cpumap, ignoring
wangying-system:12262:12276 [1] NCCL INFO Attribute coll of node net not found
wangying-system:12262:12276 [1] NCCL INFO KV Convert to int : could not find value of '' in dictionary, falling back to 60
wangying-system:12262:12276 [1] NCCL INFO === System : maxWidth 21.0 ===
wangying-system:12262:12276 [1] NCCL INFO CPU/FFFFFFFFFFFFFFFF (1/1/2)
wangying-system:12262:12276 [1] NCCL INFO + PCI[12.0] - NIC/1F0
wangying-system:12262:12276 [1] NCCL INFO + PCI[6.0] - GPU/1000 (0)
wangying-system:12262:12276 [1] NCCL INFO + NVL[21.0] - GPU/2000
wangying-system:12262:12276 [1] NCCL INFO + PCI[6.0] - GPU/2000 (1)
wangying-system:12262:12276 [1] NCCL INFO + NVL[21.0] - GPU/1000
wangying-system:12262:12276 [1] NCCL INFO ==========================================
wangying-system:12262:12276 [1] NCCL INFO GPU/1000 :GPU/1000 (0/5000.000000/LOC) GPU/2000 (1/21.000000/NVL) CPU/FFFFFFFFFFFFFFFF (1/6.000000/PHB)
wangying-system:12262:12276 [1] NCCL INFO GPU/2000 :GPU/1000 (1/21.000000/NVL) GPU/2000 (0/5000.000000/LOC) CPU/FFFFFFFFFFFFFFFF (1/6.000000/PHB)
wangying-system:12262:12276 [1] NCCL INFO Pattern 4, crossNic 0, nChannels 1, speed 21.000000/21.000000, type NVL/PIX, sameChannels 1
wangying-system:12262:12276 [1] NCCL INFO 0 : GPU/0 GPU/1
wangying-system:12262:12276 [1] NCCL INFO Pattern 2, crossNic 0, nChannels 1, speed 21.000000/21.000000, type NVL/PIX, sameChannels 1
wangying-system:12262:12276 [1] NCCL INFO 0 : GPU/0 GPU/1
wangying-system:12262:12276 [1] NCCL INFO Pattern 3, crossNic 0, nChannels 1, speed 21.000000/21.000000, type NVL/PIX, sameChannels 1
wangying-system:12262:12276 [1] NCCL INFO 0 : GPU/0 GPU/1
wangying-system:12262:12275 [0] NCCL INFO Topology detection : could not read /sys/devices/pci0000:00/0000:00:1f.6/max_link_speed, ignoring
wangying-system:12262:12275 [0] NCCL INFO Topology detection : could not read /sys/devices/pci0000:00/0000:00:1f.6/../max_link_speed, ignoring
wangying-system:12262:12275 [0] NCCL INFO Topology detection : could not read /sys/devices/pci0000:00/0000:00:1f.6/max_link_width, ignoring
wangying-system:12262:12275 [0] NCCL INFO Topology detection : could not read /sys/devices/pci0000:00/0000:00:1f.6/../max_link_width, ignoring
wangying-system:12262:12275 [0] NCCL INFO Topology detection : could not read /sys/devices/system/node/node-1/cpumap, ignoring
wangying-system:12262:12275 [0] NCCL INFO Attribute coll of node net not found
wangying-system:12262:12275 [0] NCCL INFO KV Convert to int : could not find value of '' in dictionary, falling back to 60
wangying-system:12262:12275 [0] NCCL INFO === System : maxWidth 21.0 ===
wangying-system:12262:12275 [0] NCCL INFO CPU/FFFFFFFFFFFFFFFF (1/1/2)
wangying-system:12262:12275 [0] NCCL INFO + PCI[12.0] - NIC/1F0
wangying-system:12262:12275 [0] NCCL INFO + PCI[6.0] - GPU/1000 (0)
wangying-system:12262:12275 [0] NCCL INFO + NVL[21.0] - GPU/2000
wangying-system:12262:12275 [0] NCCL INFO + PCI[6.0] - GPU/2000 (1)
wangying-system:12262:12275 [0] NCCL INFO + NVL[21.0] - GPU/1000
wangying-system:12262:12275 [0] NCCL INFO ==========================================
wangying-system:12262:12275 [0] NCCL INFO GPU/1000 :GPU/1000 (0/5000.000000/LOC) GPU/2000 (1/21.000000/NVL) CPU/FFFFFFFFFFFFFFFF (1/6.000000/PHB)
wangying-system:12262:12275 [0] NCCL INFO GPU/2000 :GPU/1000 (1/21.000000/NVL) GPU/2000 (0/5000.000000/LOC) CPU/FFFFFFFFFFFFFFFF (1/6.000000/PHB)
wangying-system:12262:12275 [0] NCCL INFO Pattern 4, crossNic 0, nChannels 1, speed 21.000000/21.000000, type NVL/PIX, sameChannels 1
wangying-system:12262:12275 [0] NCCL INFO 0 : GPU/0 GPU/1
wangying-system:12262:12275 [0] NCCL INFO Pattern 2, crossNic 0, nChannels 1, speed 21.000000/21.000000, type NVL/PIX, sameChannels 1
wangying-system:12262:12275 [0] NCCL INFO 0 : GPU/0 GPU/1
wangying-system:12262:12275 [0] NCCL INFO Pattern 3, crossNic 0, nChannels 1, speed 21.000000/21.000000, type NVL/PIX, sameChannels 1
wangying-system:12262:12275 [0] NCCL INFO 0 : GPU/0 GPU/1
wangying-system:12262:12276 [1] NCCL INFO NCCL_MAX_NCHANNELS set by environment to 1.
wangying-system:12262:12276 [1] NCCL INFO NCCL_NTHREADS set by environment to 256.
wangying-system:12262:12275 [0] NCCL INFO Channel 00/01 : 0 1
wangying-system:12262:12276 [1] NCCL INFO threadThresholds 8/8/64 | 16/8/64 | 8/8/64
wangying-system:12262:12275 [0] NCCL INFO Latency/AlgBw | Tree/ LL | Tree/ LL128 | Tree/Simple | Ring/ LL | Ring/ LL128 | Ring/Simple | CollNet/ LL | CollNet/ LL128 | CollNet/Simple |
wangying-system:12262:12275 [0] NCCL INFO Max NThreads | 256 | 640 | 256 | 256 | 640 | 256 | 256 | 640 | 256 |
wangying-system:12262:12275 [0] NCCL INFO Broadcast | 0.0/ 0.0 | 0.0/ 0.0 | 0.0/ 0.0 | 4.1/ 7.0 | 11.9/ 0.0 | 11.8/ 21.0 | 0.0/ 0.0 | 0.0/ 0.0 | 0.0/ 0.0 |
wangying-system:12262:12275 [0] NCCL INFO Reduce | 0.0/ 0.0 | 0.0/ 0.0 | 0.0/ 0.0 | 4.1/ 5.2 | 11.9/ 0.0 | 11.8/ 21.0 | 0.0/ 0.0 | 0.0/ 0.0 | 0.0/ 0.0 |
wangying-system:12262:12275 [0] NCCL INFO AllGather | 0.0/ 0.0 | 0.0/ 0.0 | 0.0/ 0.0 | 4.1/ 14.0 | 11.9/ 0.0 | 11.8/ 42.0 | 0.0/ 0.0 | 0.0/ 0.0 | 0.0/ 0.0 |
wangying-system:12262:12275 [0] NCCL INFO ReduceScatter | 0.0/ 0.0 | 0.0/ 0.0 | 0.0/ 0.0 | 4.1/ 14.0 | 11.9/ 0.0 | 11.8/ 42.0 | 0.0/ 0.0 | 0.0/ 0.0 | 0.0/ 0.0 |
wangying-system:12262:12275 [0] NCCL INFO AllReduce | 5.4/ 2.5 | 6.8/ 0.0 | 56.0/ 9.4 | 4.5/ 5.2 | 13.8/ 0.0 | 15.2/ 21.0 | 10.4/ 1.6 | 11.8/ 0.0 | 18.7/ 9.4 |
wangying-system:12262:12275 [0] NCCL INFO threadThresholds 8/8/64 | 16/8/64 | 8/8/64
wangying-system:12262:12275 [0] NCCL INFO Trees [0] 1/-1/-1->0->-1|-1->0->1/-1/-1
wangying-system:12262:12275 [0] NCCL INFO NCCL_IGNORE_CPU_AFFINITY set by environment to 1.
wangying-system:12262:12276 [1] NCCL INFO Trees [0] -1/-1/-1->1->0|0->1->-1/-1/-1
wangying-system:12262:12275 [0] NCCL INFO Channel 00 : 0[1000] -> 1[2000] via P2P/direct pointer
wangying-system:12262:12276 [1] NCCL INFO Channel 00 : 1[2000] -> 0[1000] via P2P/direct pointer
wangying-system:12262:12276 [1] NCCL INFO 1 coll channels, 1 p2p channels, 1 p2p channels per peer
wangying-system:12262:12275 [0] NCCL INFO 1 coll channels, 1 p2p channels, 1 p2p channels per peer
wangying-system:12262:12275 [0] NCCL INFO comm 0x7efbe5263900 rank 0 nranks 2 cudaDev 0 busId 1000 - Init COMPLETE
wangying-system:12262:12276 [1] NCCL INFO comm 0x7efbe8000e00 rank 1 nranks 2 cudaDev 1 busId 2000 - Init COMPLETE
#
# out-of-place in-place
# size count type redop time algbw busbw error time algbw busbw error
# (B) (elements) (us) (GB/s) (GB/s) (us) (GB/s) (GB/s)
wangying-system:12262:12262 [0] NCCL INFO AllReduce: opCount 0 sendbuff 0x7efc34000000 recvbuff 0x7efc2c000000 count 33554432 datatype 7 op 0 root 0 comm 0x7efbe5263900 [nranks=2] stream 0x563ad6fa4ee0
wangying-system:12262:12262 [0] NCCL INFO AllReduce: opCount 0 sendbuff 0x7efc0c000000 recvbuff 0x7efc04000000 count 33554432 datatype 7 op 0 root 0 comm 0x7efbe8000e00 [nranks=2] stream 0x563ad771dd20
wangying-system:12262:12262 [0] NCCL INFO Launch mode Group/CGMD
wangying-system:12262:12262 [0] NCCL INFO AllReduce: opCount 1 sendbuff 0x7efc34000000 recvbuff 0x7efc2c000000 count 33554432 datatype 7 op 0 root 0 comm 0x7efbe5263900 [nranks=2] stream 0x563ad6fa4ee0
wangying-system:12262:12262 [0] NCCL INFO AllReduce: opCount 1 sendbuff 0x7efc0c000000 recvbuff 0x7efc04000000 count 33554432 datatype 7 op 0 root 0 comm 0x7efbe8000e00 [nranks=2] stream 0x563ad771dd20
wangying-system:12262:12262 [0] NCCL INFO AllReduce: opCount 2 sendbuff 0x7efc34000000 recvbuff 0x7efc2c000000 count 33554432 datatype 7 op 0 root 0 comm 0x7efbe5263900 [nranks=2] stream 0x563ad6fa4ee0
..... many lines of sendbuff and recvbuff.......
# Out of bounds values : 0 OK
# Avg bus bandwidth : 5.39004
UPDATE : I think I found a workaround , by changing some NCCL code, it takes less than 2s to finish NCCL-TEST may need some further tests.
Thanks for the update and please let us know what workaround you found !
Your experiments didn't confirm my theory about recompilation so you can forget about JIT recompilation/compute cache -- it's probably something completely different.
Hi~~ I have wrapped it up , here we go: I added many traces and opened TRACE for logging, finally I have located the function which caused hanging: ncclTopoGetXmlFromGpu , more pecisely, when calling NVML to check NVLINK part.
So I change the code inside function ncclTopoGetXmlFromGpu in XML.cc like this: I set maxNvLinks = 1, and call only wrapNvmlDeviceGetNvLinkCapability inside this loop. this is for speeding up debuging, but it is the same phenomenon with wrapNvmlDeviceGetNvLinkState and wrapNvmlDeviceGetNvLinkRemotePciInfo
struct ncclXmlNode* nvlNode = NULL;
NCCLCHECK(xmlGetSub(pciNode, "nvlink", &nvlNode));
if (nvlNode == NULL) {
// NVML NVLink detection
int maxNvLinks = (sm < 60) ? 0 : (sm < 70) ? 4 : (sm < 80) ? 6 : 12;
if (maxNvLinks > 0 && nvmlDev == NULL) {
WARN("No NVML device handle. Skipping nvlink detection.\n");
maxNvLinks = 0;
}
maxNvLinks = 1;//add by wangying
TRACE(NCCL_ENV, "inside ncclTopoGetXmlFromGpu_2 %d,%d",maxNvLinks,sm);//addd by wangying
for (int l=0; l<maxNvLinks; ++l) {
// Check whether we can use this NVLink for P2P
unsigned canP2P;
if ((wrapNvmlDeviceGetNvLinkCapability(nvmlDev, l, NVML_NVLINK_CAP_P2P_SUPPORTED, &canP2P) != ncclSuccess) || !canP2P) continue;
TRACE(NCCL_ENV, "inside ncclTopoGetXmlFromGpu_3 %d",canP2P);//addd by wangying
// Make sure the Nvlink is up. The previous call should have trained the link.
//nvmlEnableState_t isActive;
//if ((wrapNvmlDeviceGetNvLinkState(nvmlDev, l, &isActive) != ncclSuccess) || (isActive != NVML_FEATURE_ENABLED)) continue;
// Try to figure out what's on the other side of the NVLink
//nvmlPciInfo_t remoteProc;
//if (wrapNvmlDeviceGetNvLinkRemotePciInfo(nvmlDev, l, &remoteProc) != ncclSuccess) continue;
// Make a lower case copy of the bus ID for calling ncclDeviceType
// PCI system path is in lower case
/*
char* p = remoteProc.busId;
char lowerId[NVML_DEVICE_PCI_BUS_ID_BUFFER_SIZE];
for (int c=0; c<NVML_DEVICE_PCI_BUS_ID_BUFFER_SIZE; c++) {
lowerId[c] = tolower(p[c]);
if (p[c] == 0) break;
}
TRACE(NCCL_ENV, "inside ncclTopoGetXmlFromGpu_3 ");//addd by wangying
NCCLCHECK(xmlGetSubKv(gpuNode, "nvlink", &nvlNode, "target", lowerId));
if (nvlNode == NULL) {
NCCLCHECK(xmlAddNode(xml, gpuNode, "nvlink", &nvlNode));
NCCLCHECK(xmlSetAttr(nvlNode, "target", lowerId));
NCCLCHECK(xmlSetAttrInt(nvlNode, "count", 1));
} else {
int count;
NCCLCHECK(xmlGetAttrInt(nvlNode, "count", &count));
NCCLCHECK(xmlSetAttrInt(nvlNode, "count", count+1));
}
*/
}
}
// Fill target classes
TRACE(NCCL_ENV, "inside ncclTopoGetXmlFromGpu_4,%d ",gpuNode->nSubs);//addd by wangying
From the log , it took a minute for wrapNvmlDeviceGetNvLinkCapability(nvmlDev, l, NVML_NVLINK_CAP_P2P_SUPPORTED, &canP2P) to return So I add more traces inside like this
ncclResult_t wrapNvmlDeviceGetNvLinkCapability(nvmlDevice_t device, unsigned int link,
nvmlNvLinkCapability_t capability, unsigned int *capResult) {
TRACE(NCCL_ENV, "enter wrapNvmlDeviceGetNvLinkCapability %d",link);//addd by wangying
if (nvmlInternalDeviceGetNvLinkCapability == NULL) {
/* Do not warn, this symbol is optional. */
TRACE(NCCL_ENV, "exit wrapNvmlDeviceGetNvLinkCapability_1 ");//addd by wangying
return ncclInternalError;
}
nvmlReturn_t ret;
TRACE(NCCL_ENV, "inside wrapNvmlDeviceGetNvLinkCapability_1 %d",link);//addd by wangying
NVMLLOCKCALL(nvmlInternalDeviceGetNvLinkCapability(device, link, capability, capResult), ret);
TRACE(NCCL_ENV, "inside wrapNvmlDeviceGetNvLinkCapability_2 %d",ret);//addd by wangying
if (ret != NVML_SUCCESS) {
TRACE(NCCL_ENV, "inside wrapNvmlDeviceGetNvLinkCapability_3 %d",ret);//addd by wangying
if (ret != NVML_ERROR_NOT_SUPPORTED)
INFO(NCCL_INIT,"nvmlDeviceGetNvLinkCapability() failed: %s ",
nvmlInternalErrorString(ret));
TRACE(NCCL_ENV, "inside wrapNvmlDeviceGetNvLinkCapability_4 %d",ret);//addd by wangying
return ncclSystemError;
}
TRACE(NCCL_ENV, "inside wrapNvmlDeviceGetNvLinkCapability_5 %d",ret);//addd by wangying
return ncclSuccess;
}
To avoid it is a MUTEX LOCK problem, in that case ,some other thread blocks nvmlInternalDeviceGetNvLinkCapability(), I change the nvmlwrap.h , like this, In this way, it will not get blocked and wait in anyway ,it will return NVML_ERROR_IN_USE immediately.
// The NVML library doesn't appear to be thread safe
#include <pthread.h>
extern pthread_mutex_t nvmlLock;
#define NVMLLOCK() pthread_mutex_lock(&nvmlLock)
#define NVMLUNLOCK() pthread_mutex_unlock(&nvmlLock)
#define NVMLTRYLOCK() pthread_mutex_trylock(&nvmlLock)
#define NVMLLOCKCALL(cmd, ret) do { \
ret = NVML_ERROR_IN_USE; \
if(0 ==NVMLTRYLOCK()) { \
ret = cmd; \
NVMLUNLOCK(); \
} \
} while(false)
With all changes above, and environment variables are: NCCL_DEBUG=TRACE NCCL_IGNORE_CPU_AFFINITY=1 NCCL_DEBUG_SUBSYS=ALL NCCL_DEBUG_FILE=TRACEINFO_2.%p
I ran NCCL-TEST again, the log is like this:
wangying-system:7991:8021 [0] 374.669620 ncclTopoGetXmlFromGpu:583 NCCL TRACE inside ncclTopoGetXmlFromGpu_1 0
wangying-system:7991:8021 [0] 374.705588 ncclTopoGetXmlFromGpu:612 NCCL TRACE inside ncclTopoGetXmlFromGpu_2 1,75
wangying-system:7991:8021 [0] 374.717875 wrapNvmlDeviceGetNvLinkCapability:254 NCCL TRACE enter wrapNvmlDeviceGetNvLinkCapability 0
wangying-system:7991:8021 [0] 374.729553 wrapNvmlDeviceGetNvLinkCapability:261 NCCL TRACE inside wrapNvmlDeviceGetNvLinkCapability_1 0
wangying-system:7991:8021 [0] 60381.859371 wrapNvmlDeviceGetNvLinkCapability:263 NCCL TRACE inside wrapNvmlDeviceGetNvLinkCapability_2 0
wangying-system:7991:8021 [0] 60381.896030 wrapNvmlDeviceGetNvLinkCapability:272 NCCL TRACE inside wrapNvmlDeviceGetNvLinkCapability_5 0
wangying-system:7991:8021 [0] 60381.916536 ncclTopoGetXmlFromGpu:618 NCCL TRACE inside ncclTopoGetXmlFromGpu_3 1
wangying-system:7991:8021 [0] 60381.921225 ncclTopoGetXmlFromGpu:653 NCCL TRACE inside ncclTopoGetXmlFromGpu_4,0
wangying-system:7991:8021 [0] 60381.925482 ncclTopoGetXmlFromGpu:668 NCCL TRACE finally exit ncclTopoGetXmlFromGpu,0
it shows calling nvmlInternalDeviceGetNvLinkCapability cost 60 seconds, and suprisingly returned successfully, and canP2P is 1 according to TRACE: "wangying-system:7991:8021 [0] 60381.916536 ncclTopoGetXmlFromGpu:618 NCCL TRACE inside ncclTopoGetXmlFromGpu_3 1"
So the original longtime is caused by NVML NVLINK query functions, it is functional but too high latency. Each time ncclTopoGetXmlFromGpu get called , maxNvLinks is 6, it called 6 * 3 NVML NVLINK query functions, and by 2 thread, so that is about 36 mins? but it is less than that, so maybe some calling fails and skip the maxNvLinks loop.
The workaround is comment out the " for (int l=0; l<maxNvLinks; ++l) {" loop to avoid NVLINK check. and the test speed doesn't get affected.
$ ./all_reduce_perf -b 8 -e 128M -f 2 -g 2
# nThread 1 nGpus 2 minBytes 8 maxBytes 134217728 step: 2(factor) warmup iters: 5 iters: 20 validation: 1
#
# Using devices
# Rank 0 Pid 7991 on wangying-system device 0 [0x01] GeForce RTX 2080 Ti
# Rank 1 Pid 7991 on wangying-system device 1 [0x02] GeForce RTX 2080 Ti
NCCL version 2.7.3+cuda10.1
#
# out-of-place in-place
# size count type redop time algbw busbw error time algbw busbw error
# (B) (elements) (us) (GB/s) (GB/s) (us) (GB/s) (GB/s)
8 2 float sum 32.53 0.00 0.00 0e+00 32.53 0.00 0.00 0e+00
16 4 float sum 32.52 0.00 0.00 0e+00 32.43 0.00 0.00 0e+00
32 8 float sum 32.52 0.00 0.00 0e+00 32.55 0.00 0.00 0e+00
64 16 float sum 32.50 0.00 0.00 0e+00 32.46 0.00 0.00 0e+00
128 32 float sum 32.52 0.00 0.00 0e+00 32.62 0.00 0.00 0e+00
256 64 float sum 32.79 0.01 0.01 0e+00 32.60 0.01 0.01 0e+00
512 128 float sum 32.57 0.02 0.02 0e+00 32.72 0.02 0.02 0e+00
1024 256 float sum 32.86 0.03 0.03 0e+00 32.60 0.03 0.03 0e+00
2048 512 float sum 32.86 0.06 0.06 0e+00 32.67 0.06 0.06 0e+00
4096 1024 float sum 32.74 0.13 0.13 0e+00 32.87 0.12 0.12 0e+00
8192 2048 float sum 33.35 0.25 0.25 0e+00 33.53 0.24 0.24 0e+00
16384 4096 float sum 33.49 0.49 0.49 0e+00 33.37 0.49 0.49 0e+00
32768 8192 float sum 34.17 0.96 0.96 0e+00 33.98 0.96 0.96 0e+00
65536 16384 float sum 34.10 1.92 1.92 0e+00 34.15 1.92 1.92 0e+00
131072 32768 float sum 34.62 3.79 3.79 0e+00 34.18 3.83 3.83 0e+00
262144 65536 float sum 36.66 7.15 7.15 0e+00 36.37 7.21 7.21 0e+00
524288 131072 float sum 46.45 11.29 11.29 0e+00 46.40 11.30 11.30 0e+00
1048576 262144 float sum 68.89 15.22 15.22 0e+00 69.10 15.17 15.17 0e+00
2097152 524288 float sum 116.6 17.99 17.99 0e+00 115.8 18.11 18.11 0e+00
4194304 1048576 float sum 213.2 19.67 19.67 0e+00 211.7 19.82 19.82 0e+00
8388608 2097152 float sum 420.7 19.94 19.94 0e+00 486.4 17.25 17.25 0e+00
16777216 4194304 float sum 991.1 16.93 16.93 0e+00 779.2 21.53 21.53 0e+00
33554432 8388608 float sum 1643.9 20.41 20.41 0e+00 1540.9 21.78 21.78 0e+00
67108864 16777216 float sum 3023.0 22.20 22.20 0e+00 3366.7 19.93 19.93 0e+00
134217728 33554432 float sum 6317.1 21.25 21.25 0e+00 5971.2 22.48 22.48 0e+00
# Out of bounds values : 0 OK
# Avg bus bandwidth : 7.23946
Hope it will help.
And NVML NVLINK is a library called by NCCL, so I wasn't able to trace inside NVML.
So the question for today is WHY NVML NVLINK related functions SO SLOW???
Even more updates: I decided to test NVML under Windows, with Windows 10, 2004, CUDA 10.1, NVIDIA driver: 446.14
I use the code who comes with CUDA 10.1 Windows version, and I compile it with Visual C studio 2017:
/***************************************************************************\
|* *|
|* Copyright 2010-2016 NVIDIA Corporation. All rights reserved. *|
|* *|
|* NOTICE TO USER: *|
|* *|
|* This source code is subject to NVIDIA ownership rights under U.S. *|
|* and international Copyright laws. Users and possessors of this *|
|* source code are hereby granted a nonexclusive, royalty-free *|
|* license to use this code in individual and commercial software. *|
|* *|
|* NVIDIA MAKES NO REPRESENTATION ABOUT THE SUITABILITY OF THIS SOURCE *|
|* CODE FOR ANY PURPOSE. IT IS PROVIDED "AS IS" WITHOUT EXPRESS OR *|
|* IMPLIED WARRANTY OF ANY KIND. NVIDIA DISCLAIMS ALL WARRANTIES WITH *|
|* REGARD TO THIS SOURCE CODE, INCLUDING ALL IMPLIED WARRANTIES OF *|
|* MERCHANTABILITY, NONINFRINGEMENT, AND FITNESS FOR A PARTICULAR *|
|* PURPOSE. IN NO EVENT SHALL NVIDIA BE LIABLE FOR ANY SPECIAL, *|
|* INDIRECT, INCIDENTAL, OR CONSEQUENTIAL DAMAGES, OR ANY DAMAGES *|
|* WHATSOEVER RESULTING FROM LOSS OF USE, DATA OR PROFITS, WHETHER IN *|
|* AN ACTION OF CONTRACT, NEGLIGENCE OR OTHER TORTIOUS ACTION, ARISING *|
|* OUT OF OR IN CONNECTION WITH THE USE OR PERFORMANCE OF THIS SOURCE *|
|* CODE. *|
|* *|
|* U.S. Government End Users. This source code is a "commercial item" *|
|* as that term is defined at 48 C.F.R. 2.101 (OCT 1995), consisting *|
|* of "commercial computer software" and "commercial computer software *|
|* documentation" as such terms are used in 48 C.F.R. 12.212 (SEPT 1995) *|
|* and is provided to the U.S. Government only as a commercial end item. *|
|* Consistent with 48 C.F.R.12.212 and 48 C.F.R. 227.7202-1 through *|
|* 227.7202-4 (JUNE 1995), all U.S. Government End Users acquire the *|
|* source code with only those rights set forth herein. *|
|* *|
|* Any use of this source code in individual and commercial software must *|
|* include, in the user documentation and internal comments to the code, *|
|* the above Disclaimer and U.S. Government End Users Notice. *|
|* *|
|* *|
\***************************************************************************/
//#include "cuda_kernels.h"
#include <stdio.h>
#include <nvml.h>
#include "windows.h"
#include <stdio.h>
//#include <windows.h>
//#include <tlhelp32.h>
//#include <psapi.h>
//#pragma comment(lib,"kernel32.lib")
//#pragma comment(lib,"advapi32.lib")
#pragma comment(lib,"nvml.lib")
static const char * convertToComputeModeString(nvmlComputeMode_t mode)
{
switch (mode)
{
case NVML_COMPUTEMODE_DEFAULT:
return "Default";
case NVML_COMPUTEMODE_EXCLUSIVE_THREAD:
return "Exclusive_Thread";
case NVML_COMPUTEMODE_PROHIBITED:
return "Prohibited";
case NVML_COMPUTEMODE_EXCLUSIVE_PROCESS:
return "Exclusive Process";
default:
return "Unknown";
}
}
int main(void)
{
nvmlReturn_t result;
unsigned int device_count, i;
nvmlNvLinkCapability_t nvlinkCapa;
// First initialize NVML library
result = nvmlInit();
if (NVML_SUCCESS != result)
{
printf("Failed to initialize NVML: %s\n", nvmlErrorString(result));
printf("Press ENTER to continue...\n");
getchar();
return 1;
}
result = nvmlDeviceGetCount(&device_count);
if (NVML_SUCCESS != result)
{
printf("Failed to query device count: %s\n", nvmlErrorString(result));
goto Error;
}
printf("Found %u device%s\n\n", device_count, device_count != 1 ? "s" : "");
printf("Listing devices:\n");
for (i = 0; i < device_count; i++)
{
nvmlDevice_t device;
char name[NVML_DEVICE_NAME_BUFFER_SIZE];
nvmlPciInfo_t pci;
nvmlComputeMode_t compute_mode;
// Query for device handle to perform operations on a device
// You can also query device handle by other features like:
// nvmlDeviceGetHandleBySerial
// nvmlDeviceGetHandleByPciBusId
result = nvmlDeviceGetHandleByIndex(i, &device);
if (NVML_SUCCESS != result)
{
printf("Failed to get handle for device %u: %s\n", i, nvmlErrorString(result));
goto Error;
}
result = nvmlDeviceGetName(device, name, NVML_DEVICE_NAME_BUFFER_SIZE);
if (NVML_SUCCESS != result)
{
printf("Failed to get name of device %u: %s\n", i, nvmlErrorString(result));
goto Error;
}
// pci.busId is very useful to know which device physically you're talking to
// Using PCI identifier you can also match nvmlDevice handle to CUDA device.
result = nvmlDeviceGetPciInfo(device, &pci);
if (NVML_SUCCESS != result)
{
printf("Failed to get pci info for device %u: %s\n", i, nvmlErrorString(result));
goto Error;
}
printf("%u. %s [%s]\n", i, name, pci.busId);
//add by wangying
nvlinkCapa = NVML_NVLINK_CAP_P2P_SUPPORTED;
long curTime = GetTickCount();
unsigned int canP2p;
printf("Start calling NVLINK query:%d\n", curTime);
result = nvmlDeviceGetNvLinkCapability(device, 0, nvlinkCapa, &canP2p);
if (NVML_SUCCESS != result)
{
printf("Failed to get NVLINK info for device %u: %s\n", i, nvmlErrorString(result));
goto Error;
}
printf("SUPPORT P2P:%d\n", canP2p);
long curTime1 = GetTickCount();
printf("End calling NVLINK query:%d\n", curTime1);
printf("Elapsed time:%d ms\n", curTime1 - curTime);
//add by wangying end
/*
// This is a simple example on how you can modify GPU's state
result = nvmlDeviceGetComputeMode(device, &compute_mode);
if (NVML_ERROR_NOT_SUPPORTED == result)
printf("\t This is not CUDA capable device\n");
else if (NVML_SUCCESS != result)
{
printf("Failed to get compute mode for device %u: %s\n", i, nvmlErrorString(result));
goto Error;
}
else
{
// try to change compute mode
printf("\t Changing device's compute mode from '%s' to '%s'\n",
convertToComputeModeString(compute_mode),
convertToComputeModeString(NVML_COMPUTEMODE_PROHIBITED));
result = nvmlDeviceSetComputeMode(device, NVML_COMPUTEMODE_PROHIBITED);
if (NVML_ERROR_NO_PERMISSION == result)
printf("\t\t Need root privileges to do that: %s\n", nvmlErrorString(result));
else if (NVML_ERROR_NOT_SUPPORTED == result)
printf("\t\t Compute mode prohibited not supported. You might be running on\n"
"\t\t windows in WDDM driver model or on non-CUDA capable GPU.\n");
else if (NVML_SUCCESS != result)
{
printf("\t\t Failed to set compute mode for device %u: %s\n", i, nvmlErrorString(result));
goto Error;
}
else
{
printf("\t Restoring device's compute mode back to '%s'\n",
convertToComputeModeString(compute_mode));
result = nvmlDeviceSetComputeMode(device, compute_mode);
if (NVML_SUCCESS != result)
{
printf("\t\t Failed to restore compute mode for device %u: %s\n", i, nvmlErrorString(result));
goto Error;
}
}
}*/
}
result = nvmlShutdown();
if (NVML_SUCCESS != result)
printf("Failed to shutdown NVML: %s\n", nvmlErrorString(result));
printf("All done.\n");
printf("Press ENTER to continue...\n");
getchar();
return 0;
Error:
result = nvmlShutdown();
if (NVML_SUCCESS != result)
printf("Failed to shutdown NVML: %s\n", nvmlErrorString(result));
printf("Press ENTER to continue...\n");
getchar();
return 1;
}
run result are here :
Found 2 devices
Listing devices:
0. GeForce RTX 2080 Ti [00000000:01:00.0]
Start calling NVLINK query:9166453
SUPPORT P2P:1
End calling NVLINK query:9170109
Elapsed time:3656 ms
1. GeForce RTX 2080 Ti [00000000:02:00.0]
Start calling NVLINK query:9170109
SUPPORT P2P:1
End calling NVLINK query:9170109
Elapsed time:0 ms
All done.
Press ENTER to continue...
It shows there is no issue with my hardware as under Windows environment , NVML returns nvmlDeviceGetNvLinkCapability in 3.6 seconds, while under linux it returns in exact 60 seconds, which I think it is a timer unintentionally invoking that result to return.
Thank you for this detailed report.
So if I understand correctly, the simple test above takes 3.6s on Windows, and 60s on Ubuntu 20.04 (kernel 5.4.0, driver 440.64).
Please let me know if any version is incorrect.
Both Nvidia drivers are the newest released from Nvidia website.
1) 3.6s on Windows, with NVIDIA driver: 446.14
2) 60s on Ubuntu 20.04 (Linux version 5.4.0-31-generic (buildd@lgw01-amd64-059) )
with Nvidia driver 440.82
Actually I had to modify the test to make it run on Linux ... could you confirm you ran that test on Linux ? (or some variation to replace GetTickCount by something else).
I'm trying to make sure it's a problem that's easy to reproduce with a simple test, outside of NCCL and it's not caused by something else in NCCL.
I can try to do it tomorrow, it's late I have to sleep now : )
No worries. Thanks a lot.
Hi~~ I updated the driver to 440.100, the problem still exists , any good news???
Hi, thanks for checking that. Can you confirm whether the reproducer you made for windows also exhibits the issue on Linux? That would help reproduce the problem internally.
Hi~~~~ Very bad news: Finally I get it running!!!!
here is the final result, it took 8 seconds to query nvlink status. using the same code as Windows 3.6s . with driver 440.100. (The code example.c is in CUDA 10.1 folder,it is exactly the same as the code in Windows CUDA 10.1, and comes with a makefile way out of date )
wangying@wangying-system:/usr/local/cuda-10.1/nvml/example$ sudo ./example
Found 2 devices
Listing devices:
0. GeForce RTX 2080 Ti [00000000:01:00.0]
Start calling NVLINK query:676945073
SUPPORT P2P:1
End calling NVLINK query:676953080
Elapsed time:8007 ms
1. GeForce RTX 2080 Ti [00000000:02:00.0]
Start calling NVLINK query:676953087
SUPPORT P2P:1
End calling NVLINK query:676953087
Elapsed time:0 ms
All done.
Press ENTER to continue...
Here is the code , it is almost the same as Windows 3.6s version above ,except for the getTick() is the linux version of time counting.
/***************************************************************************\
|* *|
|* Copyright 2010-2016 NVIDIA Corporation. All rights reserved. *|
|* *|
|* NOTICE TO USER: *|
|* *|
|* This source code is subject to NVIDIA ownership rights under U.S. *|
|* and international Copyright laws. Users and possessors of this *|
|* source code are hereby granted a nonexclusive, royalty-free *|
|* license to use this code in individual and commercial software. *|
|* *|
|* NVIDIA MAKES NO REPRESENTATION ABOUT THE SUITABILITY OF THIS SOURCE *|
|* CODE FOR ANY PURPOSE. IT IS PROVIDED "AS IS" WITHOUT EXPRESS OR *|
|* IMPLIED WARRANTY OF ANY KIND. NVIDIA DISCLAIMS ALL WARRANTIES WITH *|
|* REGARD TO THIS SOURCE CODE, INCLUDING ALL IMPLIED WARRANTIES OF *|
|* MERCHANTABILITY, NONINFRINGEMENT, AND FITNESS FOR A PARTICULAR *|
|* PURPOSE. IN NO EVENT SHALL NVIDIA BE LIABLE FOR ANY SPECIAL, *|
|* INDIRECT, INCIDENTAL, OR CONSEQUENTIAL DAMAGES, OR ANY DAMAGES *|
|* WHATSOEVER RESULTING FROM LOSS OF USE, DATA OR PROFITS, WHETHER IN *|
|* AN ACTION OF CONTRACT, NEGLIGENCE OR OTHER TORTIOUS ACTION, ARISING *|
|* OUT OF OR IN CONNECTION WITH THE USE OR PERFORMANCE OF THIS SOURCE *|
|* CODE. *|
|* *|
|* U.S. Government End Users. This source code is a "commercial item" *|
|* as that term is defined at 48 C.F.R. 2.101 (OCT 1995), consisting *|
|* of "commercial computer software" and "commercial computer software *|
|* documentation" as such terms are used in 48 C.F.R. 12.212 (SEPT 1995) *|
|* and is provided to the U.S. Government only as a commercial end item. *|
|* Consistent with 48 C.F.R.12.212 and 48 C.F.R. 227.7202-1 through *|
|* 227.7202-4 (JUNE 1995), all U.S. Government End Users acquire the *|
|* source code with only those rights set forth herein. *|
|* *|
|* Any use of this source code in individual and commercial software must *|
|* include, in the user documentation and internal comments to the code, *|
|* the above Disclaimer and U.S. Government End Users Notice. *|
|* *|
|* *|
\***************************************************************************/
#include <stdio.h>
#include <nvml.h>
#include <unistd.h>
#include <time.h>
unsigned getTick() {
struct timespec ts;
unsigned theTick = 0U;
clock_gettime( CLOCK_REALTIME, &ts );
theTick = ts.tv_nsec / 1000000;
theTick += ts.tv_sec * 1000;
return theTick;
}
static const char * convertToComputeModeString(nvmlComputeMode_t mode)
{
switch (mode)
{
case NVML_COMPUTEMODE_DEFAULT:
return "Default";
case NVML_COMPUTEMODE_EXCLUSIVE_THREAD:
return "Exclusive_Thread";
case NVML_COMPUTEMODE_PROHIBITED:
return "Prohibited";
case NVML_COMPUTEMODE_EXCLUSIVE_PROCESS:
return "Exclusive Process";
default:
return "Unknown";
}
}
int main(void)
{
nvmlReturn_t result;
unsigned int device_count, i;
nvmlNvLinkCapability_t nvlinkCapa;
// First initialize NVML library
result = nvmlInit();
if (NVML_SUCCESS != result)
{
printf("Failed to initialize NVML: %s\n", nvmlErrorString(result));
printf("Press ENTER to continue...\n");
getchar();
return 1;
}
result = nvmlDeviceGetCount(&device_count);
if (NVML_SUCCESS != result)
{
printf("Failed to query device count: %s\n", nvmlErrorString(result));
goto Error;
}
printf("Found %u device%s\n\n", device_count, device_count != 1 ? "s" : "");
printf("Listing devices:\n");
for (i = 0; i < device_count; i++)
{
nvmlDevice_t device;
char name[NVML_DEVICE_NAME_BUFFER_SIZE];
nvmlPciInfo_t pci;
nvmlComputeMode_t compute_mode;
// Query for device handle to perform operations on a device
// You can also query device handle by other features like:
// nvmlDeviceGetHandleBySerial
// nvmlDeviceGetHandleByPciBusId
result = nvmlDeviceGetHandleByIndex(i, &device);
if (NVML_SUCCESS != result)
{
printf("Failed to get handle for device %u: %s\n", i, nvmlErrorString(result));
goto Error;
}
result = nvmlDeviceGetName(device, name, NVML_DEVICE_NAME_BUFFER_SIZE);
if (NVML_SUCCESS != result)
{
printf("Failed to get name of device %u: %s\n", i, nvmlErrorString(result));
goto Error;
}
// pci.busId is very useful to know which device physically you're talking to
// Using PCI identifier you can also match nvmlDevice handle to CUDA device.
result = nvmlDeviceGetPciInfo(device, &pci);
if (NVML_SUCCESS != result)
{
printf("Failed to get pci info for device %u: %s\n", i, nvmlErrorString(result));
goto Error;
}
printf("%u. %s [%s]\n", i, name, pci.busId);
//add by wangying
nvlinkCapa = NVML_NVLINK_CAP_P2P_SUPPORTED;
long curTime = getTick();//GetTickCount();
unsigned int canP2p;
printf("Start calling NVLINK query:%ld\n", curTime);
result = nvmlDeviceGetNvLinkCapability(device, 0, nvlinkCapa, &canP2p);
if (NVML_SUCCESS != result)
{
printf("Failed to get NVLINK info for device %u: %s\n", i, nvmlErrorString(result));
goto Error;
}
printf("SUPPORT P2P:%d\n", canP2p);
long curTime1 = getTick();//GetTickCount();
printf("End calling NVLINK query:%ld\n", curTime1);
printf("Elapsed time:%ld ms\n", (curTime1 - curTime));
//add by wangying end
// This is a simple example on how you can modify GPU's state
/*
result = nvmlDeviceGetComputeMode(device, &compute_mode);
if (NVML_ERROR_NOT_SUPPORTED == result)
printf("\t This is not CUDA capable device\n");
else if (NVML_SUCCESS != result)
{
printf("Failed to get compute mode for device %u: %s\n", i, nvmlErrorString(result));
goto Error;
}
else
{
// try to change compute mode
printf("\t Changing device's compute mode from '%s' to '%s'\n",
convertToComputeModeString(compute_mode),
convertToComputeModeString(NVML_COMPUTEMODE_PROHIBITED));
result = nvmlDeviceSetComputeMode(device, NVML_COMPUTEMODE_PROHIBITED);
if (NVML_ERROR_NO_PERMISSION == result)
printf("\t\t Need root privileges to do that: %s\n", nvmlErrorString(result));
else if (NVML_ERROR_NOT_SUPPORTED == result)
printf("\t\t Compute mode prohibited not supported. You might be running on\n"
"\t\t windows in WDDM driver model or on non-CUDA capable GPU.\n");
else if (NVML_SUCCESS != result)
{
printf("\t\t Failed to set compute mode for device %u: %s\n", i, nvmlErrorString(result));
goto Error;
}
else
{
printf("\t Restoring device's compute mode back to '%s'\n",
convertToComputeModeString(compute_mode));
result = nvmlDeviceSetComputeMode(device, compute_mode);
if (NVML_SUCCESS != result)
{
printf("\t\t Failed to restore compute mode for device %u: %s\n", i, nvmlErrorString(result));
goto Error;
}
}
}
*/
}
result = nvmlShutdown();
if (NVML_SUCCESS != result)
printf("Failed to shutdown NVML: %s\n", nvmlErrorString(result));
printf("All done.\n");
printf("Press ENTER to continue...\n");
getchar();
return 0;
Error:
result = nvmlShutdown();
if (NVML_SUCCESS != result)
printf("Failed to shutdown NVML: %s\n", nvmlErrorString(result));
printf("Press ENTER to continue...\n");
getchar();
return 1;
}
And the most interesting part is here, as I changed the makefile to this:
ARCH := $(shell getconf LONG_BIT)
OS := $(shell cat /etc/issue)
#RHEL_OS := $(shell cat /etc/redhat-release)
# Gets Driver Branch
DRIVER_BRANCH := $(shell nvidia-smi | grep Driver | cut -f 3 -d' ' | cut -f 1 -d '.')
# Location of the CUDA Toolkit
CUDA_PATH ?= "/usr/local/cuda-10.1"
ifeq (${ARCH},$(filter ${ARCH},32 64))
# If correct architecture and libnvidia-ml library is not found
# within the environment, build using the stub library
ifneq (,$(findstring Ubuntu,$(OS)))
DEB := $(shell dpkg -l | grep cuda)
ifneq (,$(findstring cuda, $(DEB)))
NVML_LIB := /usr/lib/x86_64-linux-gnu
#/usr/lib/nvidia-$(DRIVER_BRANCH)
else
NVML_LIB := /usr/lib/x86_64-linux-gnu
#/lib${ARCH}
endif
endif
ifneq (,$(findstring SUSE,$(OS)))
RPM := $(shell rpm -qa cuda*)
ifneq (,$(findstring cuda, $(RPM)))
NVML_LIB := /usr/lib${ARCH}
else
NVML_LIB := /lib${ARCH}
endif
endif
ifneq (,$(findstring CentOS,$(RHEL_OS)))
RPM := $(shell rpm -qa cuda*)
ifneq (,$(findstring cuda, $(RPM)))
NVML_LIB := /usr/lib${ARCH}/nvidia
else
NVML_LIB := /lib${ARCH}
endif
endif
ifneq (,$(findstring Red Hat,$(RHEL_OS)))
RPM := $(shell rpm -qa cuda*)
ifneq (,$(findstring cuda, $(RPM)))
NVML_LIB := /usr/lib${ARCH}/nvidia
else
NVML_LIB := /lib${ARCH}
endif
endif
ifneq (,$(findstring Fedora,$(RHEL_OS)))
RPM := $(shell rpm -qa cuda*)
ifneq (,$(findstring cuda, $(RPM)))
NVML_LIB := /usr/lib${ARCH}/nvidia
else
NVML_LIB := /lib${ARCH}
endif
endif
else
NVML_LIB := ../../lib${ARCH}/stubs/
$(info "libnvidia-ml.so.1" not found, using stub library.)
endif
ifneq (${ARCH},$(filter ${ARCH},32 64))
$(error Unknown architecture!)
endif
#NVML_LIB += ../lib/
NVML_LIB_L := $(addprefix -L , $(NVML_LIB))
CFLAGS := -I ../../include -I ../include
LDFLAGS := -lnvidia-ml $(NVML_LIB_L)
all: example supportedVgpus
example: example.o
$(CC) $< $(CFLAGS) $(LDFLAGS) -o $@
supportedVgpus: supportedVgpus.o
$(CC) $< $(CFLAGS) $(LDFLAGS) -o $@
clean:
-@rm -f example.o
-@rm -f example
-@rm -f supportedVgpus.o
-@rm -f supportedVgpus
The makefile runs like this:
wangying@wangying-system:/usr/local/cuda-10.1/nvml/example$ sudo make example
cc -I ../../include -I ../include -c -o example.o example.c
cc example.o -I ../../include -I ../include -lnvidia-ml -L /usr/lib/x86_64-linux-gnu -o example
The main problem is the libnvidia-ml.so file. I changed it in makefile to /usr/lib/x86_64-linux-gnu/libnvidia-ml.so , and created a soft-link libnvidia-ml.so to libnvidia-ml.so.440.100 ( 1.5 MB) ,then it runs well.
The original and only libnvidia-ml.so in my system is in /usr/lib/i386-linux-gnu and linked to libnvidia-ml.so.1 linked to libnvidia-ml.so.440.100 (1.6MB ) in that folder , which I guess is the 32 bit version of libnvidia-ml.so
It seems the problem is : when a program calls nvlink query , it may call the 32 bit version of nvidia-ml.so ?
But I compile and link example.c again with the 32-bit version of libnvidia-ml.so , linux ld seems skip linking 32-bit version of nvidia-ml.so ,says it is not compatible.
And I compile NCCL 2.7.3 again, then run NCCL-TESTS, it still took 60s for nvmlDeviceGetNvLinkCapability to return.
So the problem stays in NCCL, but I can't explain why it took NCCL 60s calling nvmlDeviceGetNvLinkCapability, but 8 seconds for example.cc and 3.6s in Windows.
Interesting, although I'm still unsure what's going on here.
Can you run ldd example
in both cases to see which NVML library your test is using ? I would really be surprised if we're using the 32 bit version in the case that is slow.
The fact NCCL is still slow could be because NCCL does not link against NVML, it loads the library dynamically, so it might end up using the wrong one.
which two cases should I use ldd example? for windows case I copied the nvml.dll to the source folder.
---Original--- From: "Sylvain Jeaugey"<notifications@github.com> Date: Wed, Jul 8, 2020 00:42 AM To: "NVIDIA/nccl"<nccl@noreply.github.com>; Cc: "Author"<author@noreply.github.com>;"AlexWang1900"<41888506@qq.com>; Subject: Re: [NVIDIA/nccl] NCCL 2.6.4 makes system hanging. (#340)
Interesting, although I'm still unsure what's going on here.
Can you run ldd example in both cases to see which NVML library your test is using ? I would really be surprised if we're using the 32 bit version in the case that is slow.
The fact NCCL is still slow could be because NCCL does not link against NVML, it loads the library dynamically, so it might end up using the wrong one.
— You are receiving this because you authored the thread. Reply to this email directly, view it on GitHub, or unsubscribe.
You mentioned on Linux, first you could reproduce the issue (the test took 8 seconds to complete). Then changing the Makefile you could get it to run normally.
So in each case, it would be good to run ldd to understand which library it was using and why the difference.
I may have confused you,I can manage to run example.c on linux in only one condition: that is the case took 8 seconds and with the makefile changed. I thought 8 seconds was normal compares 60 seconds. and in the same level as 3.6sec on Windows.
any other change like switch lib version, location, will not pass the gcc compiling+linking.
I think I should try to find out which version NCCL use when the 60s case happens. But how?
---Original--- From: "Sylvain Jeaugey"<notifications@github.com> Date: Wed, Jul 8, 2020 01:13 AM To: "NVIDIA/nccl"<nccl@noreply.github.com>; Cc: "Author"<author@noreply.github.com>;"AlexWang1900"<41888506@qq.com>; Subject: Re: [NVIDIA/nccl] NCCL 2.6.4 makes system hanging. (#340)
You mentioned on Linux, first you could reproduce the issue (the test took 8 seconds to complete). Then changing the Makefile you could get it to run normally.
So in each case, it would be good to run ldd to understand which library it was using and why the difference.
— You are receiving this because you authored the thread. Reply to this email directly, view it on GitHub, or unsubscribe.
Right, I got confused indeed.
8 seconds seems still high, but it is only a problem if it's 8 seconds per call. And it seems the call on GPU 1 did not take any time, so I'm wondering if each NVLink test would take 8 seconds. Could you replace :
// get time...
result = nvmlDeviceGetNvLinkCapability(device, 0, nvlinkCapa, &canP2p);
// print time...
by
for (int link=0; link<NVML_NVLINK_MAX_LINKS; link++) {
// get time ...
result = nvmlDeviceGetNvLinkCapability(device, link, nvlinkCapa, &canP2p);
// print time ...
}
And see if it also takes 8s for the other NVLinks ?
All that said, I do not see why it would take 8 seconds inside the test and 60 seconds in NCCL, but the fact it's almost a round number of seconds is suggesting we're hitting a timeout in a special error case.
Also we could not reproduce the problem on a similar setup (2x RTX 2080Ti, Ubuntu 20.04, Driver 440.100), so it might be an issue specific to your platform / device.
Note : on 20.04 you can compile with nvcc -ccbin gcc-7
to simplify the path detection (you need to install gcc-7 with apt if not done already), e.g. :
/usr/local/cuda/bin/nvcc -ccbin gcc-7 example.c -lnvidia-ml
That avoids the complex Makefile.
Thanks a lot !!! 1 , ldd result:
wangying@wangying-system:/usr/local/cuda/nvml/example$ ldd example
linux-vdso.so.1 (0x00007ffdb25f0000)
libnvidia-ml.so.1 => /lib/x86_64-linux-gnu/libnvidia-ml.so.1 (0x00007effb26ce000)
libc.so.6 => /lib/x86_64-linux-gnu/libc.so.6 (0x00007effb24dc000)
libpthread.so.0 => /lib/x86_64-linux-gnu/libpthread.so.0 (0x00007effb24b9000)
libdl.so.2 => /lib/x86_64-linux-gnu/libdl.so.2 (0x00007effb24b3000)
wangying@wangying-system:~/nccl-tests-master/build$ ldd all_reduce_perf
linux-vdso.so.1 (0x00007ffe98b9a000)
libcudart.so.10.1 => /usr/local/cuda/lib64/libcudart.so.10.1 (0x00007f02eb6c9000)
libnccl.so.2 => /usr/local/cuda/lib64/libnccl.so.2 (0x00007f02e6841000)
libpthread.so.0 => /lib/x86_64-linux-gnu/libpthread.so.0 (0x00007f02e6803000)
libstdc++.so.6 => /lib/x86_64-linux-gnu/libstdc++.so.6 (0x00007f02e6622000)
libc.so.6 => /lib/x86_64-linux-gnu/libc.so.6 (0x00007f02e6430000)
/lib64/ld-linux-x86-64.so.2 (0x00007f02eba47000)
libdl.so.2 => /lib/x86_64-linux-gnu/libdl.so.2 (0x00007f02e642a000)
librt.so.1 => /lib/x86_64-linux-gnu/librt.so.1 (0x00007f02e641d000)
libm.so.6 => /lib/x86_64-linux-gnu/libm.so.6 (0x00007f02e62ce000)
libgcc_s.so.1 => /lib/x86_64-linux-gnu/libgcc_s.so.1 (0x00007f02e62b3000)
wangying@wangying-system:/usr/local/cuda/lib64$ ldd libnccl.so.2.6.4
linux-vdso.so.1 (0x00007ffd828fd000)
libpthread.so.0 => /lib/x86_64-linux-gnu/libpthread.so.0 (0x00007fec666f3000)
librt.so.1 => /lib/x86_64-linux-gnu/librt.so.1 (0x00007fec666e8000)
libdl.so.2 => /lib/x86_64-linux-gnu/libdl.so.2 (0x00007fec666e2000)
libstdc++.so.6 => /lib/x86_64-linux-gnu/libstdc++.so.6 (0x00007fec66501000)
libm.so.6 => /lib/x86_64-linux-gnu/libm.so.6 (0x00007fec663b2000)
libgcc_s.so.1 => /lib/x86_64-linux-gnu/libgcc_s.so.1 (0x00007fec66397000)
libc.so.6 => /lib/x86_64-linux-gnu/libc.so.6 (0x00007fec661a3000)
/lib64/ld-linux-x86-64.so.2 (0x00007fec6b5bb000)
it seems nccl has no link to libnvml
2 , test "example" for other nvlink id greater than 0 I test 4 cases: case 1: test 6 times for nvlink id 0:
//add by wangying
nvlinkCapa = NVML_NVLINK_CAP_P2P_SUPPORTED;
unsigned int canP2p;
for (int link=0; link<6; link++) {
long curTime = getTick();//GetTickCount();
printf("Start calling NVLINK query:%ld\n", curTime);
result = nvmlDeviceGetNvLinkCapability(device, 0, nvlinkCapa, &canP2p);
if (NVML_SUCCESS != result)
{
printf("Failed to get NVLINK info for device %u: %s\n", i, nvmlErrorString(result));
//goto Error;
}
printf("SUPPORT P2P:%d\n", canP2p);
long curTime1 = getTick();//GetTickCount();
printf("End calling NVLINK query:%ld\n", curTime1);
printf("Elapsed time:%ld ms\n", (curTime1 - curTime));
}
//add by wangying end
result: each query cost 8s for card 0, and 0ms for card 1
$ sudo ./example
Found 2 devices
Listing devices:
0. GeForce RTX 2080 Ti [00000000:01:00.0]
Start calling NVLINK query:830722690
SUPPORT P2P:1
End calling NVLINK query:830730697
Elapsed time:8007 ms
Start calling NVLINK query:830730697
SUPPORT P2P:1
End calling NVLINK query:830738706
Elapsed time:8009 ms
Start calling NVLINK query:830738706
SUPPORT P2P:1
End calling NVLINK query:830746713
Elapsed time:8007 ms
Start calling NVLINK query:830746714
SUPPORT P2P:1
End calling NVLINK query:830754722
Elapsed time:8008 ms
Start calling NVLINK query:830754722
SUPPORT P2P:1
End calling NVLINK query:830762729
Elapsed time:8007 ms
Start calling NVLINK query:830762729
SUPPORT P2P:1
End calling NVLINK query:830770737
Elapsed time:8008 ms
1. GeForce RTX 2080 Ti [00000000:02:00.0]
Start calling NVLINK query:830770746
SUPPORT P2P:1
End calling NVLINK query:830770747
Elapsed time:1 ms
Start calling NVLINK query:830770747
SUPPORT P2P:1
End calling NVLINK query:830770747
Elapsed time:0 ms
Start calling NVLINK query:830770747
SUPPORT P2P:1
End calling NVLINK query:830770747
Elapsed time:0 ms
Start calling NVLINK query:830770747
SUPPORT P2P:1
End calling NVLINK query:830770747
Elapsed time:0 ms
Start calling NVLINK query:830770747
SUPPORT P2P:1
End calling NVLINK query:830770747
Elapsed time:0 ms
Start calling NVLINK query:830770747
SUPPORT P2P:1
End calling NVLINK query:830770748
Elapsed time:1 ms
All done.
Press ENTER to continue...
case 2: query from nvlink id 0 to 5 code change to :result = nvmlDeviceGetNvLinkCapability(device, link, nvlinkCapa, &canP2p); result: same result as case 1:
$ sudo ./example
Found 2 devices
Listing devices:
0. GeForce RTX 2080 Ti [00000000:01:00.0]
Start calling NVLINK query:831109742
SUPPORT P2P:1
End calling NVLINK query:831117749
Elapsed time:8007 ms
Start calling NVLINK query:831117749
SUPPORT P2P:1
End calling NVLINK query:831125757
Elapsed time:8008 ms
Start calling NVLINK query:831125757
SUPPORT P2P:1
End calling NVLINK query:831133765
Elapsed time:8008 ms
Start calling NVLINK query:831133765
SUPPORT P2P:1
End calling NVLINK query:831141773
Elapsed time:8008 ms
Start calling NVLINK query:831141773
SUPPORT P2P:1
End calling NVLINK query:831149781
Elapsed time:8008 ms
Start calling NVLINK query:831149781
SUPPORT P2P:1
End calling NVLINK query:831157789
Elapsed time:8008 ms
1. GeForce RTX 2080 Ti [00000000:02:00.0]
Start calling NVLINK query:831157796
SUPPORT P2P:1
End calling NVLINK query:831157796
Elapsed time:0 ms
Start calling NVLINK query:831157796
SUPPORT P2P:1
End calling NVLINK query:831157796
Elapsed time:0 ms
Start calling NVLINK query:831157796
SUPPORT P2P:1
End calling NVLINK query:831157796
Elapsed time:0 ms
Start calling NVLINK query:831157796
SUPPORT P2P:1
End calling NVLINK query:831157796
Elapsed time:0 ms
Start calling NVLINK query:831157796
SUPPORT P2P:1
End calling NVLINK query:831157796
Elapsed time:0 ms
Start calling NVLINK query:831157796
SUPPORT P2P:1
End calling NVLINK query:831157796
Elapsed time:0 ms
All done.
Press ENTER to continue...
case 3, upon case2 ,query card 1 first then card0 result: card 1 cost 0ms, card0 cost 8s
$ sudo ./example
Found 2 devices
Listing devices:
1. GeForce RTX 2080 Ti [00000000:02:00.0]
Start calling NVLINK query:831569359
SUPPORT P2P:1
End calling NVLINK query:831569359
Elapsed time:0 ms
Start calling NVLINK query:831569359
SUPPORT P2P:1
End calling NVLINK query:831569359
Elapsed time:0 ms
Start calling NVLINK query:831569359
SUPPORT P2P:1
End calling NVLINK query:831569359
Elapsed time:0 ms
Start calling NVLINK query:831569359
SUPPORT P2P:1
End calling NVLINK query:831569359
Elapsed time:0 ms
Start calling NVLINK query:831569359
SUPPORT P2P:1
End calling NVLINK query:831569359
Elapsed time:0 ms
Start calling NVLINK query:831569359
SUPPORT P2P:1
End calling NVLINK query:831569359
Elapsed time:0 ms
0. GeForce RTX 2080 Ti [00000000:01:00.0]
Start calling NVLINK query:831569365
SUPPORT P2P:1
End calling NVLINK query:831577373
Elapsed time:8008 ms
Start calling NVLINK query:831577373
SUPPORT P2P:1
End calling NVLINK query:831585381
Elapsed time:8008 ms
Start calling NVLINK query:831585381
SUPPORT P2P:1
End calling NVLINK query:831593389
Elapsed time:8008 ms
Start calling NVLINK query:831593389
SUPPORT P2P:1
End calling NVLINK query:831601397
Elapsed time:8008 ms
Start calling NVLINK query:831601397
SUPPORT P2P:1
End calling NVLINK query:831609405
Elapsed time:8008 ms
Start calling NVLINK query:831609405
SUPPORT P2P:1
End calling NVLINK query:831617413
Elapsed time:8008 ms
Press ENTER to continue...
case 4 query sequence: 0->1->0 result: for card0, 8 seconds, for card 1, 0ms
Finally!! At last!!!!! Thanks!!! OMG!!!! LOL!!!!!!!!
for the test above ,I decided to swith pci slot for two cards, after I unplug the nvlink bridge, and card 0, I found out the nvlink bridge cannot plug in fully because the nvlink plastic case is 3-4mm thicker, it got blocked from watercooling kit on card 0. and for card 1, it can be fully plugged in.
I tear up the NVLINK BRIDGE, use only the pcb board and outer case, and plug it in fully.
Now everything runs smoothly!!
example.c: 0ms
/usr/local/cuda/nvml/example$ sudo ./example
Found 2 devices
Listing devices:
0. GeForce RTX 2080 Ti [00000000:01:00.0]
Start calling NVLINK query:839863977
SUPPORT P2P:1
End calling NVLINK query:839863977
Elapsed time:0 ms
Start calling NVLINK query:839863977
SUPPORT P2P:1
End calling NVLINK query:839863977
Elapsed time:0 ms
Start calling NVLINK query:839863977
SUPPORT P2P:1
End calling NVLINK query:839863977
Elapsed time:0 ms
Start calling NVLINK query:839863977
SUPPORT P2P:1
End calling NVLINK query:839863977
Elapsed time:0 ms
Start calling NVLINK query:839863977
SUPPORT P2P:1
End calling NVLINK query:839863977
Elapsed time:0 ms
Start calling NVLINK query:839863977
SUPPORT P2P:1
End calling NVLINK query:839863977
Elapsed time:0 ms
1. GeForce RTX 2080 Ti [00000000:02:00.0]
Start calling NVLINK query:839863982
SUPPORT P2P:1
End calling NVLINK query:839863983
Elapsed time:1 ms
Start calling NVLINK query:839863983
SUPPORT P2P:1
End calling NVLINK query:839863983
Elapsed time:0 ms
Start calling NVLINK query:839863983
SUPPORT P2P:1
End calling NVLINK query:839863983
Elapsed time:0 ms
Start calling NVLINK query:839863983
SUPPORT P2P:1
End calling NVLINK query:839863983
Elapsed time:0 ms
Start calling NVLINK query:839863983
SUPPORT P2P:1
End calling NVLINK query:839863983
Elapsed time:0 ms
Start calling NVLINK query:839863983
SUPPORT P2P:1
End calling NVLINK query:839863983
Elapsed time:0 ms
0. GeForce RTX 2080 Ti [00000000:01:00.0]
Start calling NVLINK query:839863983
SUPPORT P2P:1
End calling NVLINK query:839863983
Elapsed time:0 ms
Start calling NVLINK query:839863983
SUPPORT P2P:1
End calling NVLINK query:839863984
Elapsed time:1 ms
Start calling NVLINK query:839863984
SUPPORT P2P:1
End calling NVLINK query:839863984
Elapsed time:0 ms
Start calling NVLINK query:839863984
SUPPORT P2P:1
End calling NVLINK query:839863984
Elapsed time:0 ms
Start calling NVLINK query:839863984
SUPPORT P2P:1
End calling NVLINK query:839863984
Elapsed time:0 ms
Start calling NVLINK query:839863984
SUPPORT P2P:1
End calling NVLINK query:839863984
Elapsed time:0 ms
All done.
Press ENTER to continue...
nccl-tests runs less than 1second, and doubles the bandwidth.
/nccl-tests-master/build$ ./all_reduce_perf -b 8 -e 128M -f 2 -g 2
# nThread 1 nGpus 2 minBytes 8 maxBytes 134217728 step: 2(factor) warmup iters: 5 iters: 20 validation: 1
#
# Using devices
# Rank 0 Pid 3576 on wangying-system device 0 [0x01] GeForce RTX 2080 Ti
# Rank 1 Pid 3576 on wangying-system device 1 [0x02] GeForce RTX 2080 Ti
NCCL version 2.6.4+cuda10.1
#
# out-of-place in-place
# size count type redop time algbw busbw error time algbw busbw error
# (B) (elements) (us) (GB/s) (GB/s) (us) (GB/s) (GB/s)
8 2 float sum 14.30 0.00 0.00 0e+00 13.73 0.00 0.00 0e+00
16 4 float sum 23.49 0.00 0.00 0e+00 13.39 0.00 0.00 0e+00
32 8 float sum 13.96 0.00 0.00 0e+00 13.29 0.00 0.00 0e+00
64 16 float sum 14.00 0.00 0.00 0e+00 13.37 0.00 0.00 0e+00
128 32 float sum 14.68 0.01 0.01 0e+00 13.87 0.01 0.01 0e+00
256 64 float sum 14.00 0.02 0.02 0e+00 13.42 0.02 0.02 0e+00
512 128 float sum 14.01 0.04 0.04 0e+00 13.59 0.04 0.04 0e+00
1024 256 float sum 14.14 0.07 0.07 0e+00 13.44 0.08 0.08 0e+00
2048 512 float sum 13.75 0.15 0.15 0e+00 35.19 0.06 0.06 0e+00
4096 1024 float sum 13.65 0.30 0.30 0e+00 13.85 0.30 0.30 0e+00
8192 2048 float sum 74.19 0.11 0.11 0e+00 13.41 0.61 0.61 0e+00
16384 4096 float sum 15.60 1.05 1.05 0e+00 14.74 1.11 1.11 0e+00
32768 8192 float sum 17.93 1.83 1.83 0e+00 19.26 1.70 1.70 0e+00
65536 16384 float sum 20.00 3.28 3.28 0e+00 19.46 3.37 3.37 0e+00
131072 32768 float sum 24.55 5.34 5.34 0e+00 23.82 5.50 5.50 0e+00
262144 65536 float sum 41.89 6.26 6.26 0e+00 55.21 4.75 4.75 0e+00
524288 131072 float sum 46.52 11.27 11.27 0e+00 46.73 11.22 11.22 0e+00
1048576 262144 float sum 55.81 18.79 18.79 0e+00 55.87 18.77 18.77 0e+00
2097152 524288 float sum 80.77 25.96 25.96 0e+00 76.93 27.26 27.26 0e+00
4194304 1048576 float sum 127.4 32.92 32.92 0e+00 190.7 22.00 22.00 0e+00
8388608 2097152 float sum 259.8 32.29 32.29 0e+00 220.5 38.04 38.04 0e+00
16777216 4194304 float sum 403.9 41.53 41.53 0e+00 404.2 41.51 41.51 0e+00
33554432 8388608 float sum 869.4 38.60 38.60 0e+00 853.9 39.30 39.30 0e+00
67108864 16777216 float sum 1700.6 39.46 39.46 0e+00 1505.6 44.57 44.57 0e+00
134217728 33554432 float sum 3159.4 42.48 42.48 0e+00 2975.7 45.11 45.11 0e+00
# Out of bounds values : 0 OK
# Avg bus bandwidth : 12.1413
Thanks for the feedback. Happy to see it was solved.
Could you confirm whether there was any message in dmesg
or /var/log/syslog
about NVLink detection timing out ? I'm realizing I never asked you to check the kernel logs, and it might be good to document here what the potential error messages are.
Let me know, thanks !
I checked the /var/log/syslog on July. 7th which is the most recent day I have an NCCL-TEST 60s happend. I can't find anything suspicious regarding NVIDIA, NVLINK , pci, pci-e nvml 60 seconds, 6000 ms , timer, time out, and for "dmesg" it has 3 records which happen only when PC power on showing something successfully started.
Thanks. Also, feel free to close the bug if all is understood.
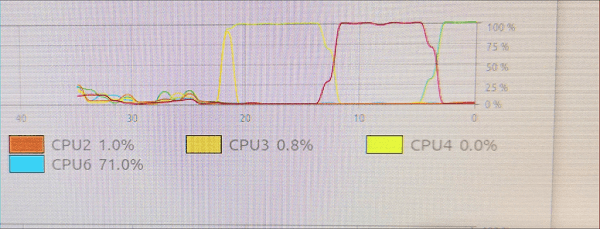
Linux: Ubuntu 20.04 LTS GPU driver: newest NVidia driver for linux. CUDA 10.1, CUDNN ,7.6.5 NCCL 2.6.4 Hardware : CPU: Intel 9400f, MB: Z370,Ram : 64GB 2-channel, GPU: 2 2080ti on 2 PCIE 3.0 *8, with a NVlink bridge between them
I ran all nccl_tests, it seems NCCL is working. But when each test running(about 30 min for each test), the system freezes, I can't switch to browser or doing anything, I can only move the mouse, but the system doesn't respond to mouse-clicking or keyboard input. when the test finishes running, system goes back to normal ,and LOG prints in console.
log is here:
originally I found this issue with training with Tensorflow, I first submit bug to TENSORFLOW , here is the link:https://github.com/tensorflow/tensorflow/issues/40027
it shows when I remove NVLINK BRIDGE, the TF code runs well , and when I using NVLINK BRIDGE, but not using NCCL, the TF code runs well too. but when I using NCCL and NVLINK BRIDGE, the system halt, make me have to reboot.