We need to implement a React Gantt chart to keep track of all projects and work packages.
Current Features
Literally nothing
Desired Additional Features
Minimum:
Gantt Chart with all projects and work packages (fixed size)
Work packages are beneath projects and can be expanded or hidden by clicking the project (acts as a toggle)
Projects and WP's are ordered numerically
Bonus:
On home page
WP's user is working on/assigned are highlighted
Auto-expand said projects
Toggleable feature to auto expand/collapse all projects and WP's
Stylish (pastels maybe?...use coolors.co for easy color palettes) <- easy on the eyes please, I'll be staring at it for more time than you think.
Show project completion percentage visually; percent of the project "filled in" by darker color
Hovering over the chart highlights the column and row that you're in (preferably something like a light gray that's just for visual's sake)
On hover, pull up following information; End date/ deadline, Budget, Link, Duration
Filtration by project buckets (Electric, Dynamic, Static)
"Tooltip" when WP name is clicked on that displays critical information:
Budget
Spend
Active CR's
3 most recent approved/implemented CR's
Original Start, Original End Time, Updated End Time
Clicking on the project name (that's in the "tooltip") redirects you to the WP's full page
*Note: Please build with the premise that the gantt chart can be made to be interactable in the future. Eg. drag the timeline of a WP and it'll automatically pop up a CR for you to start with the timeline impact already inputted
Just tacking on something from last year that I found again. But being able to visually see how many times a WP has been delayed from the gantt would be huge. Sort of merges together with my other ticket.
Description
We need to implement a React Gantt chart to keep track of all projects and work packages.
Current Features
Literally nothing
Desired Additional Features
Minimum:
Bonus:
*Note: Please build with the premise that the gantt chart can be made to be interactable in the future. Eg. drag the timeline of a WP and it'll automatically pop up a CR for you to start with the timeline impact already inputted
Example of a Gantt Chart:
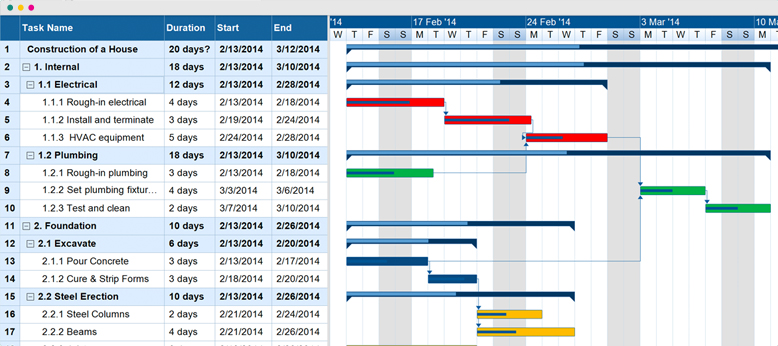
Mock