Open-Mobile-Robotics / open-process-library

Open Process Library
MIT License
14 stars 2 forks source link

Draft a Demo Process Screen #15

Open andy-gxpaasio opened 1 month ago

andy-gxpaasio commented 1 month ago

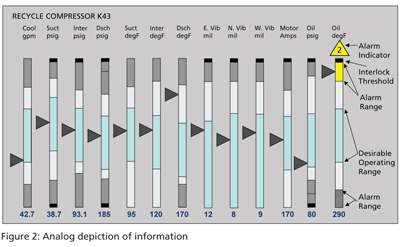
Coming from discussions in #3 we should probably draft an example P&ID and functional spec for a PEA/Unit that will serve as a single screen typical for the visual and logical components being developed. We can start with the visualization and then work to build out a simple narrative around how the logic should function to help coalesce and focus efforts around building components that need to work well together not only visually but also logically.

kjetilnordby commented 1 month ago

We likely have capacity of starting a conversion the 10th of June. The time it takes will depend on how many changes we need to make in our system and what we are missing.

aott33 commented 1 month ago

@andy-gxpaasio, what do you propose we use for drafting up the P&ID? Draw.io may work for a basic P&ID and has some collaborative capabilities when saving in Google Drive.

durinwinter commented 1 month ago

I agree with Andy that if we can spec out an example PEA it would be a good basis for both the logical and visual elements.

andy-gxpaasio commented 1 month ago

@andy-gxpaasio, what do you propose we use for drafting up the P&ID? Draw.io may work for a basic P&ID and has some collaborative capabilities when saving in Google Drive.

Yeah I can draft up the start of a P&ID. I've used Draw.IO and that should work just fine. Instead of getting fancy I can just save in my personal G drive in a shared folder and go from there.

andy-gxpaasio commented 1 month ago

Alright everyone, I think this is just barely good enough for people to look at and complain

https://app.diagrams.net/#G1moyjevhMiJ7TYoZd7KcFSae3-05c3_K9#%7B%22pageId%22%3A%22k1n6h8jkSEw-FPHGM1Yq%22%7D

I have "started" a really terribly styled P&ID but the style of the P&ID isn't really the point. I am trying to lay down a unit with some typical instrumentation and equipment so we can debate for a bit on what all we should work on first and more critically have a concept for the Open Bridge team to replicate but look way way better.

One really cool thing I found in Draw.IO is they have a really large process library and the shapes are pretty dang good, especially the valves. For pumps I've personally become a fan of a circle with a triangle in it but we can build a few different ones.

Let's have some folks try to access this and see if I need to adjust security. The file itself is stored in Google drive but I've given open access to the world so let me know what happens. My expectation is that anyone can use the link above and edit the drawing.

zantiu commented 1 month ago

should the transfer and circulation pump not be combined? And then add an open-close valve in the circulation loop? Also add an agitator. Maybe agitator with fixed speed so we still have both the VFD (pump) and the fixed speed.

And if we want to do a higher density screen we can duplicate it 3 times, and add some ingredient tanks on top and buffer tanks on the bottom.

kjetilnordby commented 1 month ago

What is the squares with circles inside?

zantiu commented 1 month ago

Typically the square indicates that the instrument/device is connected to the control system. (There are also instruments on a P&ID without squares, which means they only have an indicator in the field)

TT = Temperature Transmitter LT = Level Transmitter ... LSH = Level Switch High ...

andy-gxpaasio commented 1 month ago

should the transfer and circulation pump not be combined? And then add an open-close valve in the circulation loop? Also add an agitator. Maybe agitator with fixed speed so we still have both the VFD (pump) and the fixed speed.

And if we want to do a higher density screen we can duplicate it 3 times, and add some ingredient tanks on top and buffer tanks on the bottom.

Thoguht about agitator later last night. That's a good one. As for the pumps, I was synthesizing a way to get a couple types (VFD and fixed speed) of pumps on there but you aren't wrong in saying form a process standpoint it could probably be done with one. We could maybe also put a peristaltic on the additive line just to show a different visual for a pump.

Go ahead and make whatever updates you think appropriate.

andy-gxpaasio commented 1 month ago

Typically the square indicates that the instrument/device is connected to the control system. (There are also instruments on a P&ID without squares, which means they only have an indicator in the field)

TT = Temperature Transmitter LT = Level Transmitter ... LSH = Level Switch High ...

The subtle concept here is that the TT is the physical transmitter with the electronics in the field. Then it comes back into the control system where it is read, processed, scaled, etc. and the representation in the control system becomes a TI. TT is usually a single value, typically 0-100% based, and maybe a quality signal if the wires are good or bad.. but then in the control system the TI has the scaled value, alarm status, and lots of other attributes.

On our operator displays we will show TI, PI, LI but I wanted to get back to my olden days working with P&ID's and show how you would see it accurately on one of those drawings.

Another point, I am drawing in the P&ID style but that isn't always the symbols we want to use on the screen. Sometimes they are (valves, pumps, tanks) but for things like value displays we are not visually representing things like they are drawn on the P&ID

Which just reminded me, I need to take the fill bar off the tank if this is a P&ID.

Arzicc commented 1 month ago

I had some issues accessing the diagram at first, but then after authorizing I opened it via Google Drive and gone back to draw.io from there.

I found a excerpt of the ISA 5.1 naming and graphical standards for P&IDs in case anybody needs a reference

https://banner9.icesi.edu.co/ic_contenidos_pdf/adjuntos/202210/202210_11459_12897.pdf

I'd say the first two pages are the most important to understand the logic behind the conventions

Arzicc commented 1 month ago

I've made an attempt at a jacketed vessel. Similar to Andy's but with an agitator and a temperature controller.

https://drive.google.com/file/d/1mFukl5ekoD7Oheo4qgwhHDdJCJrKF9I3/view?usp=drive_link

(Hm, the draw app won't let me give its own link, tells me to share via Google Drive, should work anyway I think)

I'll repeat Andy's point on the P&ID including symbols which we don't usually show on HMIs: "I am drawing in the P&ID style but that isn't always the symbols we want to use on the screen. Sometimes they are (valves, pumps, tanks) but for things like value displays we are not visually representing things like they are drawn on the P&ID."

In this case, for example, TIC (temperature controller with indication) is not generally shown as its own symbol. There's of course a section somewhere in the HMI with the controller data, like set point or tuning parameters in the case of PID control, but not a symbol of its own like in P&ID.

Also the different lines indicating the way the signal is transmitted are not generally shown on HMIs (the dashed line means electrical, and the line with the two segments going to the valves means pneumatic).

andy-gxpaasio commented 1 month ago

I love the new diagram. Definitely in line with my idea of me laying down a start and other joining in to fine tune and expand. I took yours and copied it into another sheet labeled R-101

Can you check to see if you can edit it there. If you can't then maybe we need to get a couple people on a call to figure out the collaboration side of this so we aren't all creating different files.

And your notes about my sloppiness on symbology are dead on. I was trying to just get some stuff laid down as a seed. Lets keep watering this thing and improving it.

andy-gxpaasio commented 1 month ago

I had some issues accessing the diagram at first, but then after authorizing I opened it via Google Drive and gone back to draw.io from there.

I found a excerpt of the ISA 5.1 naming and graphical standards for P&IDs in case anybody needs a reference

https://banner9.icesi.edu.co/ic_contenidos_pdf/adjuntos/202210/202210_11459_12897.pdf

I'd say the first two pages are the most important to understand the logic behind the conventions

Yeah 5.1 is our bible. What gets difficult is when people (including me on my example) do it about 70% - then the reader is left wondering about things that don't seem to fit the design standard. Seen too many examples of this in my day.

One thing I would caution this group at large, especially people who aren't from the process industry, is I don't want us to get too wrapped up on the finer points of standards like 5.1 as it relates to our work. My idea being I think we are here to come up with great libraries for logic and visualizations. We can vigorously debate what we should name the attributes on our modules or how the valve should look but I don't think we should delve into how to name a 3rd temperature transmitter with a HH alarm on a tank. Standards bodies have already addressed those topics and they are well adopted in industry.

durinwinter commented 1 month ago

I agree with this. The truth is there are a lot of decorators and attributes that can be applied by end users in much the same way the themes and pallettes work in Open bridge. The actual magic is being able to represent the object that way in the users chosen system.

Andy has the completely right idea about this.

Arzicc commented 1 month ago

Oh no! I did not want to imply any sloppiness on your part Andy! 🙏 Sorry if any message on my part could have been interpreted as so, I'm not a native speaker etc. etc.

I totally agree with both of you

And I can also edit the new R101 tab in your file, all good; the truth is I wanted to play a bit with draw.io first, so I copied my own personal file in order not to mess up anything.

andy-gxpaasio commented 1 month ago

Oh no! I did not want to imply any sloppiness on your part Andy! 🙏 Sorry if any message on my part could have been interpreted as so, I'm not a native speaker etc. etc.

I totally agree with both of you

And I can also edit the new R101 tab in your file, all good; the truth is I wanted to play a bit with draw.io first, so I copied my own personal file in order not to mess up anything.

No worries at all - definitely did not read your comment that way. I was intentionally quick and loose with the drawing because I don't want anyone to get the idea that these representations need to be very good at all. We just need to get some ideas down in a common place. Just good enough to have a reference for representing with the OpenBridge components.

kjetilnordby commented 3 weeks ago

We are ready to trying to make a sketch using OpenBridge. Is it any example that you prefer we recreate? @andy-gxpaasio

zantiu commented 2 weeks ago

@kjetilnordby Andy only posted one example. I think that one is good.

kjetilnordby commented 2 weeks ago

Examples - Google Disk - Google Chrome 6_13_2024 1_06_37 PM This is the one? @zantiu :-)

zantiu commented 2 weeks ago

Yes

Arzicc commented 2 weeks ago

Yes, I did make the other one with the agitator but this is good as well

zantiu commented 2 weeks ago

Oh right we need the agitator :)

sunnivalis commented 2 weeks ago

image IAS - No comments IAs - comments

Hi, I work together with Kjetil and I made a rough draft for this system. Please give comments on what works and what doesn't. The sketch is also marked with questions that would be great to know more about:)

sunnivalis commented 2 weeks ago

@zantiu @Arzicc :-)

zantiu commented 2 weeks ago

Nice start

And then the last one is the 'hollow' piping. It looks nice. But my worry is that we cannot draw it like that in most hmi's? Typically we just do a filled line, no edges showing.

sunnivalis commented 2 weeks ago

IAs - comments-1 IAs - comments Frame 2718

Here are some updated sketches based on the comments from @zantiu, in addition to some questions i have about the tank. It would be great to get some more comments on these new sketches and I can do another round. @zantiu @Arzicc

zantiu commented 2 weeks ago

@andy-gxpaasio ?

Arzicc commented 2 weeks ago

Hi, good job

sunnivalis commented 1 week ago

IAs - comments-1 IAs - comments

Thank you for the feedback!

I’ve made two new examples that are very similar to the previous one.

  1. Pumps: the first sketch shows how the pumps can be shown the same using a triangle to indicate direction. He second one uses the shape on the top to indicate direction in addition to the small arrow below. It’s always possible to choose which of these styles to use, depending on wether it is required to see the type of pump. I can also look into making the direction more clear if it still reads unclear to you? 


  2. I removed the black arrows completely, but they are a part of the component library and can always be added in other systems if needed. 


  3. The page links are more condensed than the earliest sketch. Here they are all made in a button style to show that they are clickable. If, they are not, only the text will show, not the border or fill. 


  4. When you say that we need to show all tags, does that also include the tags for temperature-, pressure- and other transmitters? 


  5. Multiple temperature transmitters in the tank: If they are put there for redundancy, is it possible to only display the one computed value? And if the value from the transmitters differ you will have an alert notification, and by clicking on the tank you get more info about the transmitters and how they are measuring different values? (I did not go into sparklines or embedded charts yet)


  6. Level switches: I don’t fully understand level switches yet, do you guys have any more references of how they are represented in other interfaces or any links that are relevant for me to read? Is it something that you can turn on/off? What do they do?

sunnivalis commented 1 week ago

@Arzicc @zantiu

zantiu commented 1 week ago

Yes show all tags when tag visualization is active Yes show both transmitters

Arzicc commented 1 week ago
  1. Looking good! I can definitely see "more traditional" operations use the more detailed style, and the others the triangle-in-circle one. I'll put this here just to give more context: traditionally, another element which indicates pump direction on HMIs is the way the two pipe sections, i.e. the ones before & after the pump, are arranged. The preceding pipe joins the pump in the center, while the following section departs tangential to the symbol. This comes from how pumps are physically built. I'm mentioning this just to give more context, not because I think we should replicate it. With the simple triangle-in-circle symbol, it does not make much sense anyway; it might have some sense with the other symbol style, but let's not complicate things. Here's two examples, one and two.

2, 3. OK

  1. Yes, you should allow some space in order to show some very brief text, usually the tag name, eg. TT5052, PT3021. Usually it is put even if it is obvious what instrument that one is, for example if there's a single pressure transmitter on a tank and it is obvious that that the pressure readout on that tank image is referring to it.

  2. Yes, I'd say it is something you can do, but this is dependent on the requirements of the project, no clear answer on this. (IMHO showing minimal info if everything is alright and showing more only if some anomaly occurs is what I would default to; this is more consistent with the ISA-101/High Performance HMI philosophy, but it depends).

  3. (I'm making this example with level, but temperature/pressure/... is the same) The difference is between a device which will just send a ON/OFF signal (="reached"/"not reached"), and another one which will measure that phenomenon; in the latter case, you can compare the measurement against a threshold, in the former, you don't have the measurement, just information from the device that the phenomenon is "below" or "above". Sometimes in a plant there are both devices - the measuring one could for example be used for normal operation, and the ON/OFF one could be used, along with a threashold on the measuring device, in order to guarantee some redundancy for safety condition. Imagine a tank with a level transmitter, and a level switch physically put in a "LowLow" position. There's is a pump pulling liquid from that tank, and you definitely don't want the pump to run while dry. So you can use both a "LowLow" threshold derived from the trasmitter and the "LowLow" level switch if you want to be extra sure to be aware of when there's not enough liquid in the tank. So yeah, the important thing to understand in this case, as @zantiu said, is that such ON/OFF devices are a separate detection from the measuring analog device, so it is incorrect to show the ON/OFF signal as it derived from the analog scale like the thresholds instead do. As @zantiu says, typically we would put a simple square and the tag.

[But nothing stops you from being creative! you could consider it as an alarm condition on the analog readout, if there were one along with the ON/OFF device... but let's not worry for this last case as it simply falls into the "alarm" case of a analog value.]