 maxmargraf
commented
2 months ago
maxmargraf
commented
2 months ago Here are some examples of plots and metric calculation from pycomlink:
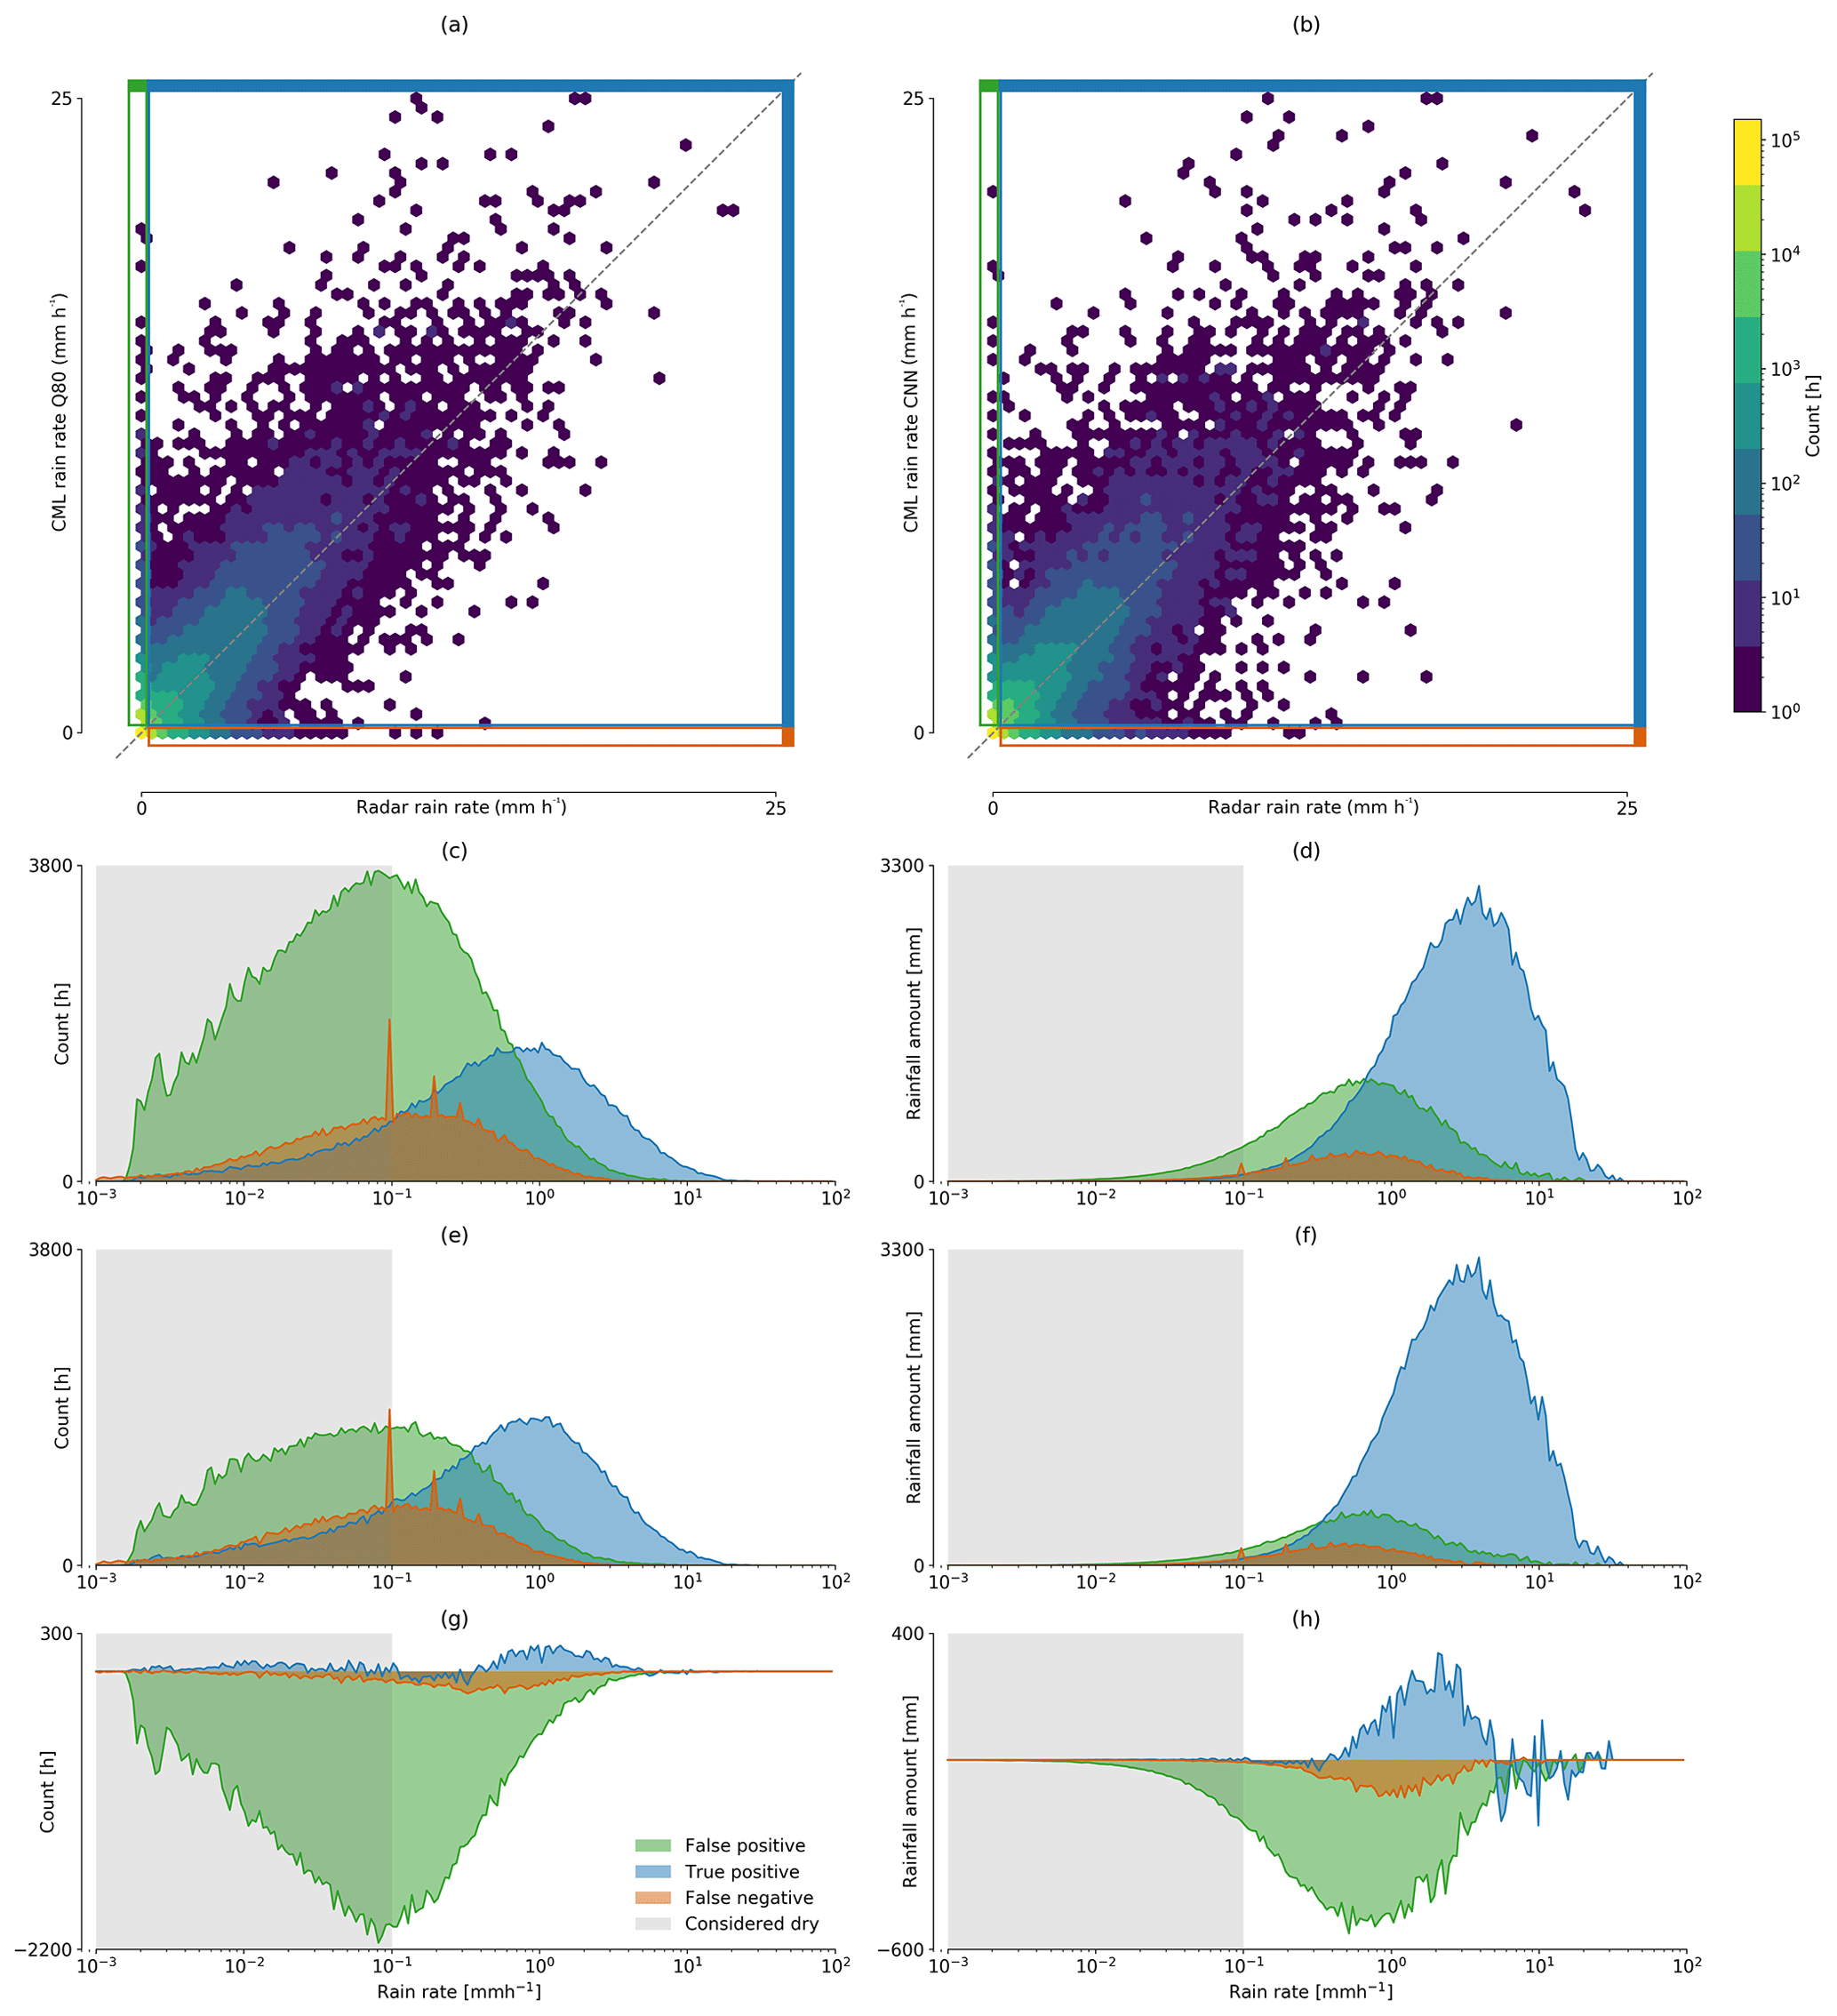
- This notebook contains a basic hexbin plot in cell 24.
- Cell 25 of the same notebook shows the results of the function
calc_rain_error_performance_metrics()from pycomlink calculating several performance metrics using a lower threshold for rainfall (for both reference and observed values). There is alsocalc_wet_dry_performance_metrics()in pycomlink which calculates binary metrics between two datasets, without the specification of a lower rainfall threshold - regarding a histogram from FPs and FNs shown here, I will try to provide a simple code snippet in the near future.
Things we could add, based on discussion today: