Oshlack / splatter

Simple simulation of single-cell RNA sequencing data
GNU General Public License v3.0
213 stars 56 forks source link

Simulation of one sided differential expression #148

Closed jackbibby1 closed 2 years ago

jackbibby1 commented 2 years ago

Hi there,

Thanks for the great package.

I'm currently trying to simulate a bunch of expression files that contain 2 groups with increasing levels of differential expression. When I run this, it works well:

# libraries ---------------------------------------------------------------
library(Seurat)
library(splatter)
library(tidyverse)

# generate params ---------------------------------------------------------
sim_params <- newSplatParams()

# generate datasets with increased de prob --------------------------------
de_prob <- seq(0.1, 0.9, 0.1)
de_data <- list()
for (i in de_prob) {

  cat("Generating data with", i, "de prob", "\n")

  params <- setParams(sim_params, update = list("nGenes" = 200, "batchCells" = 1500,
                                                "group.prob" = c(0.5, 0.5),
                                                "de.prob" = i,
                                                "de.facLoc" = 0.3))

  sim <- splatSimulate(params, method = "groups")
  df <- sim@assays@data$counts

  df <- CreateSeuratObject(df) %>%
    NormalizeData()
  df$group <- sim$Group

  de_data[[as.character(i)]] <- df

}

# check simulation --------------------------------------------------------
### number of de genes per de prob parameter
for (i in names(de_data)) {
  Idents(de_data[[i]]) <- "group"
}

mks <- list()
for (i in names(de_data)) {
  mks[[i]] <- FindAllMarkers(de_data[[i]], only.pos = T)
}

sapply(mks, function(x) x %>% filter(p_val_adj < 0.05) %>% nrow())

### direction of de genes
sapply(mks, function(x) x %>% pull(cluster) %>% table()) %>%
  t() %>%
  data.frame() %>%
  rownames_to_column("de") %>%
  mutate(Group1 = -Group1) %>%
  pivot_longer(cols = Group1:Group2, names_to = "direction", values_to = "genes") %>%
  ggplot(aes(de, genes, group = direction)) +
  geom_col(aes(fill = direction), col = "black", lwd = 0.3) +
  labs(y = "Number of DE genes per group", x = "de prob") +
  scale_fill_manual(values = c("tomato", "cornflowerblue"),
                    name = "Group") +
  theme(panel.background = element_blank(),
        panel.border = element_rect(fill = NA))

no_down

This is all good, showing increasing number of de genes with increasing de.prob value, and also that the number of de genes per group are pretty equivalent. I'm then trying to simulate similar datasets where the differentially expressed genes are unidirectional e.g. all de genes in the datasets are unregulated in Group1. To do this, I'm using the de.downProb parameter (I hope I'm understanding the documentation OK?), setting it to either 0 or 1 e.g. :

de_prob <- seq(0.1, 0.9, 0.1)
de_data <- list()
for (i in de_prob) {

  cat("Generating data with", i, "de prob", "\n")

  params <- setParams(sim_params, update = list("nGenes" = 200, "batchCells" = 1500,
                                                "group.prob" = c(0.5, 0.5),
                                                "de.prob" = i,
                                                "de.downProb" = 1,
                                                "de.facLoc" = 0.3))

  sim <- splatSimulate(params, method = "groups")
  df <- sim@assays@data$counts

  df <- CreateSeuratObject(df) %>%
    NormalizeData()
  df$group <- sim$Group

  de_data[[as.character(i)]] <- df

}

(using the same code as above to visualize the de genes) de_down

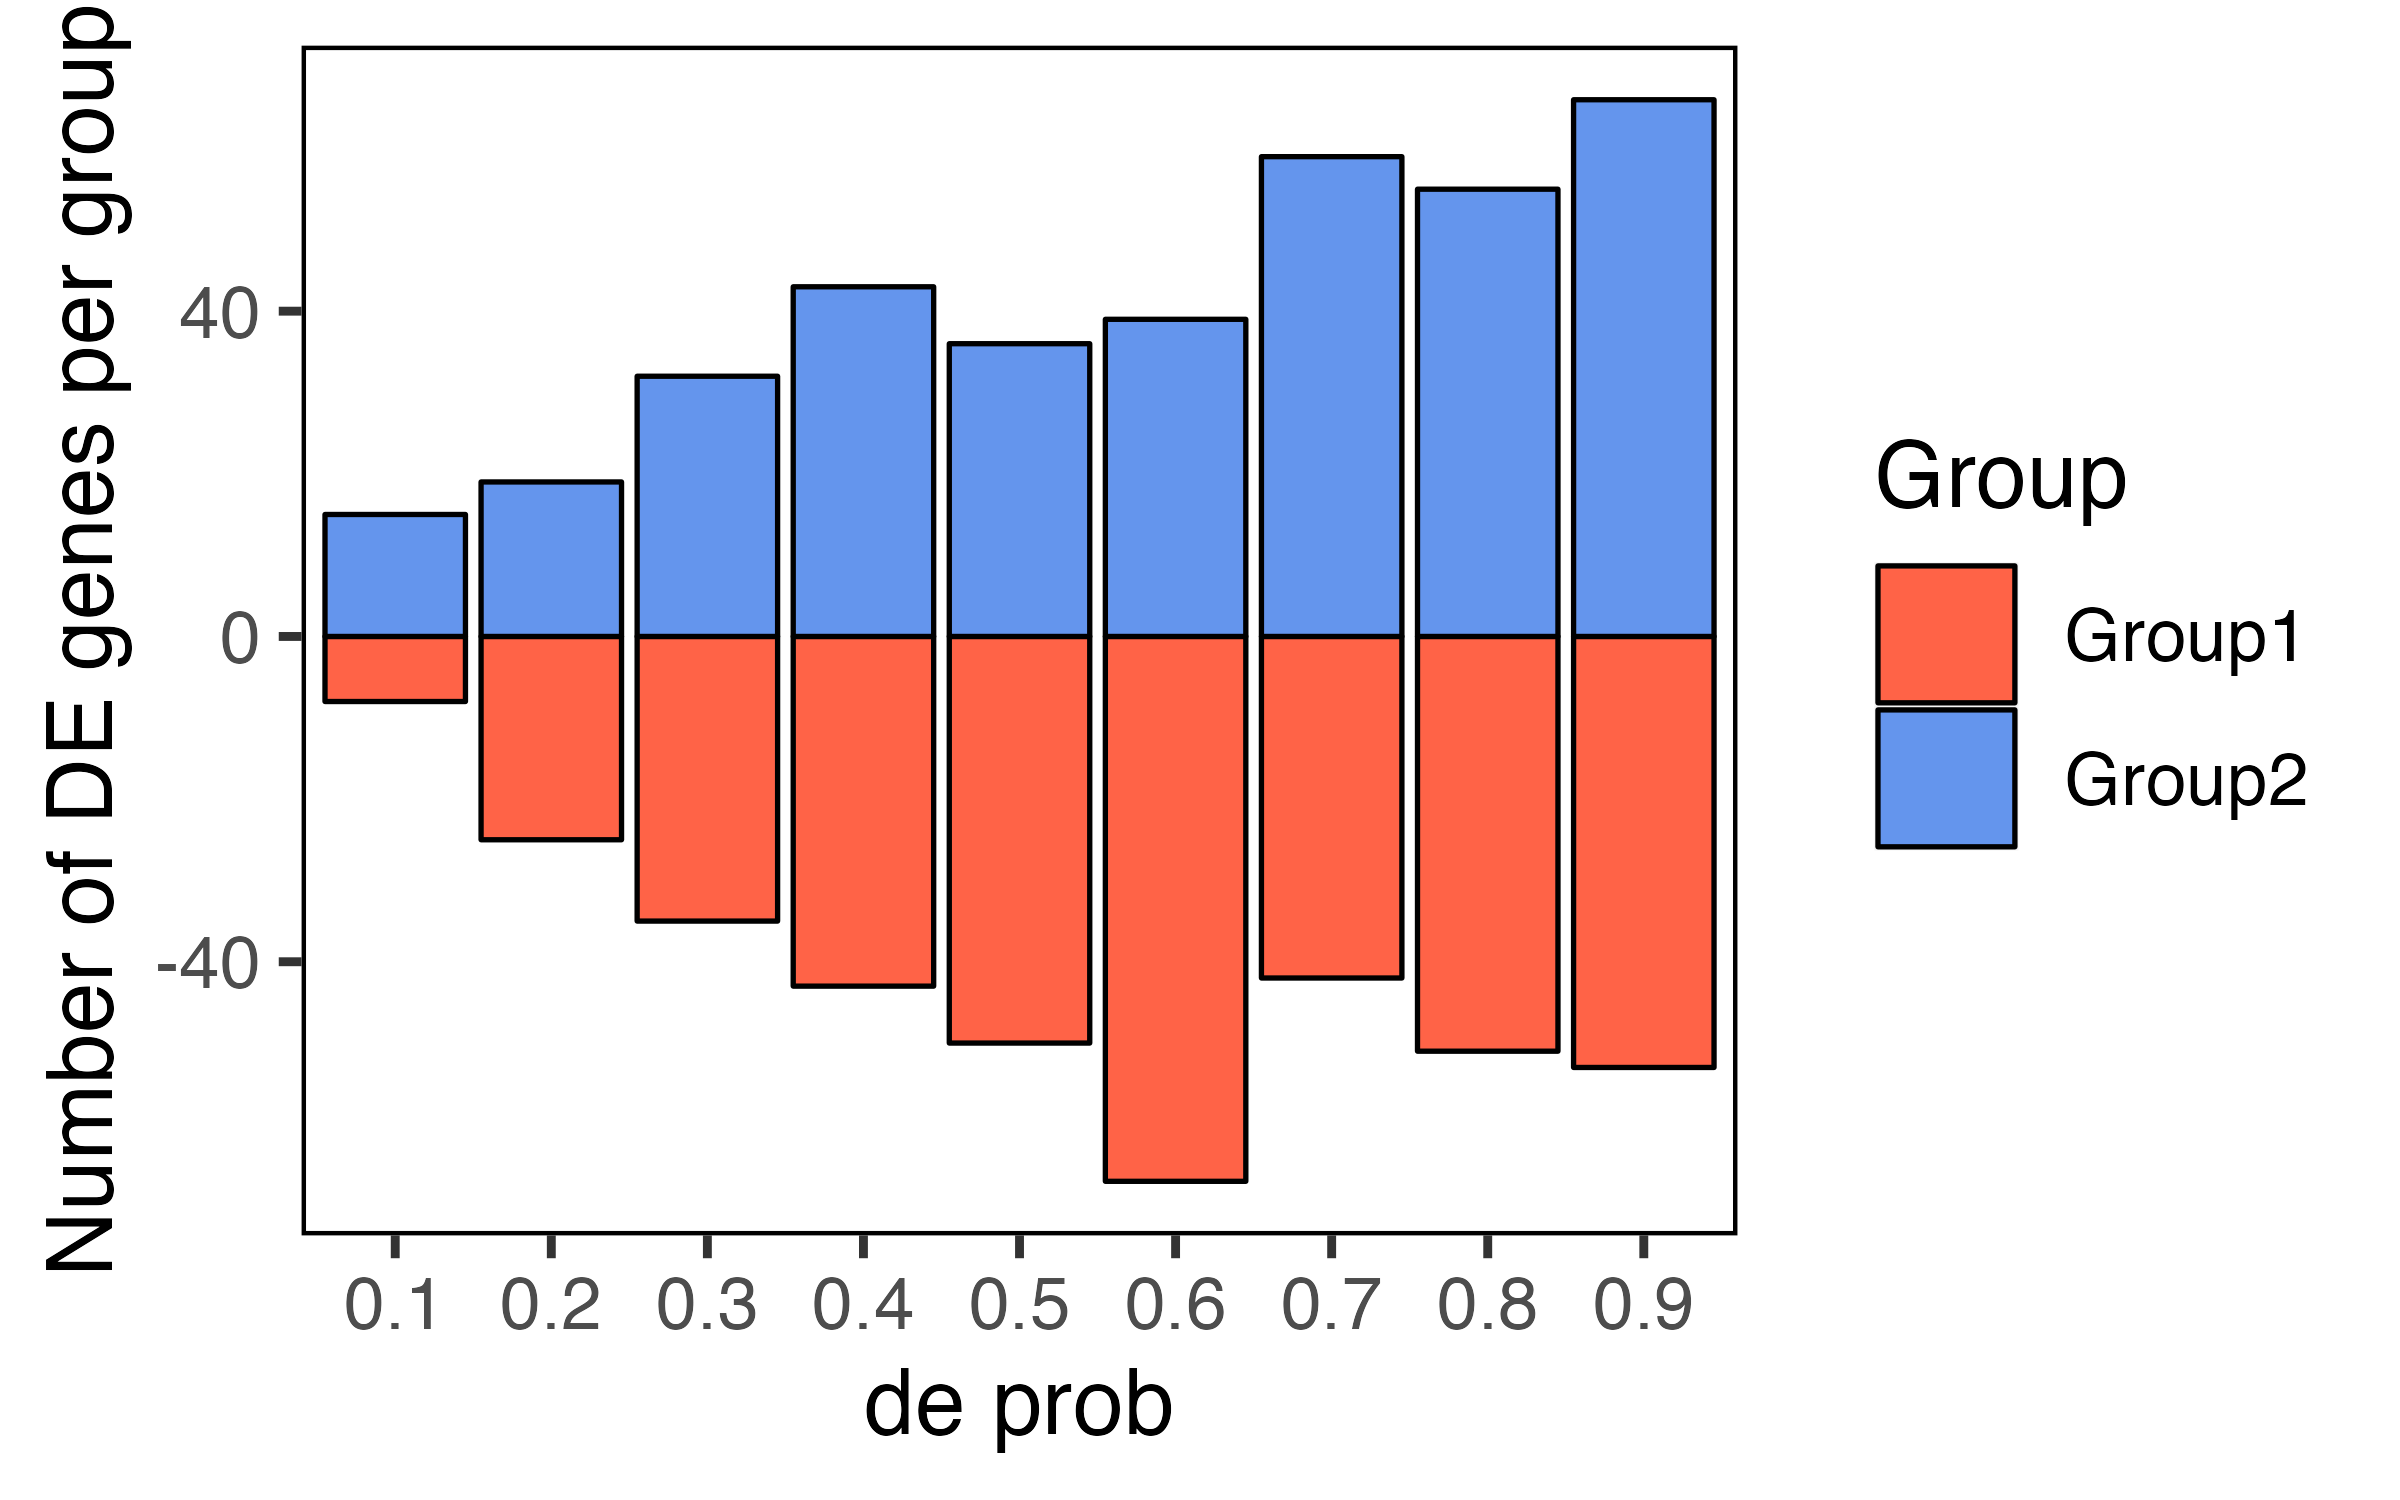
But this doesn't seem to work -- it ends up with a pretty similar distribution of directionality in de genes between the groups. Do you have an idea on what's going on here? Or can you suggest a better way to simulate the data where de genes are unidirectional?

Many thanks Jack

jackbibby1 commented 2 years ago

Sorry, I'll also add that I've tried using: de.downProb = c(0, 1), and it seems like it's kind of working, but not really. e.g.

de_prob <- seq(0.1, 0.9, 0.1)
de_data <- list()
for (i in de_prob) {

  cat("Generating data with", i, "de prob", "\n")

  params <- setParams(sim_params, update = list("nGenes" = 200, "batchCells" = 1500,
                                                "group.prob" = c(0.5, 0.5),
                                                "de.prob" = i,
                                                "de.downProb" = c(0, 1),
                                                "de.facLoc" = 0.3))

  sim <- splatSimulate(params, method = "groups")
  df <- sim@assays@data$counts

  df <- CreateSeuratObject(df) %>%
    NormalizeData()
  df$group <- sim$Group

  de_data[[as.character(i)]] <- df

}

# I also just filtered out some of the de genes with small changes here, but it's broadly similar
sapply(mks, function(x) x %>% filter(p_val_adj < 0.05 & avg_log2FC > 0.4) %>% pull(cluster) %>% table()) %>%
  t() %>%
  data.frame() %>%
  rownames_to_column("de") %>%
  mutate(Group1 = -Group1) %>%
  pivot_longer(cols = Group1:Group2, names_to = "direction", values_to = "genes") %>%
  ggplot(aes(de, genes, group = direction)) +
  geom_col(aes(fill = direction), col = "black", lwd = 0.3) +
  labs(y = "Number of DE genes per group", x = "de prob") +
  scale_fill_manual(values = c("tomato", "cornflowerblue"),
                    name = "Group") +
  theme(panel.background = element_blank(),
        panel.border = element_rect(fill = NA))

de_down

lazappi commented 2 years ago

Hi @jackbibby1

Thanks for giving {splatter} a go! I probably need to look at this more closely but my first thought is to try setting de.prob so that only one of the groups has DE genes (i.e. de.prob = c(0, i)). That should make things simpler and hopefully solve your problem or at least make it easier to see what is going on.

jackbibby1 commented 2 years ago

Hi @lazappi

Thanks for getting back.

I've re-ran things with the de.prob = c(i, 0)...

# libraries ---------------------------------------------------------------
library(Seurat)
library(splatter)
library(tidyverse)

# generate params ---------------------------------------------------------
sim_params <- newSplatParams()

# generate datasets with increased de prob --------------------------------
de_prob <- seq(0.1, 0.9, 0.1)
de_data <- list()
for (i in de_prob) {

  cat("Generating data with", i, "de prob", "\n")

  params <- setParams(sim_params, update = list("nGenes" = 200, 
                                                "batchCells" = 1000,
                                                "group.prob" = c(0.5, 0.5),
                                                "de.prob" = c(i, 0),
                                                "de.facLoc" = 0.3))

  sim <- splatSimulate(params, method = "groups")
  df <- sim@assays@data$counts

  df <- CreateSeuratObject(df) %>%
    NormalizeData()
  df$group <- sim$Group
  Idents(df) <- "group"

  de_data[[as.character(i)]] <- df

}

# check simulation --------------------------------------------------------
### number of de genes per de prob parameter
mks <- list()
for (i in names(de_data)) {
  mks[[i]] <- FindAllMarkers(de_data[[i]], only.pos = T)
}

sapply(mks, function(x) x %>% filter(p_val_adj < 0.05) %>% nrow())

### direction of de genes
sapply(mks, function(x) x %>% filter(p_val_adj < 0.05 & avg_log2FC > 0.4) %>% pull(cluster) %>% table()) %>%
  t() %>%
  data.frame() %>%
  rownames_to_column("de") %>%
  mutate(Group1 = -Group1) %>%
  pivot_longer(cols = Group1:Group2, names_to = "direction", values_to = "genes") %>%
  ggplot(aes(de, genes, group = direction)) +
  geom_col(aes(fill = direction), col = "black", lwd = 0.3) +
  labs(y = "Number of DE genes per group", x = "de prob") +
  scale_fill_manual(values = c("tomato", "cornflowerblue"),
                    name = "Group") +
  theme(panel.background = element_blank(),
        panel.border = element_rect(fill = NA))

de_no_down

That looks like it's getting there, but there's still a lot of differential expression in both groups. I've also tried the same code above but also running de.downProb = c(1, 0) and get this (This looks like it works well up to de.prob = ~0.5/0.6, but then tails off. Hmm. I'm unsure what's happening here):

de_down

lazappi commented 2 years ago

Could you try plotting the actual DE factors stored in rowData(sim) rather than the results from the DE testing? If those aren't correct then it's a bug but if they look ok this might just be due to noise (will take a bit more thinking to work out exactly why though).

I would also suggest either simulating more genes or adjusting the library size parameters. With the parameters you have now all the genes probably have very high counts regardless of their base expression levels which could be messing with things.

jackbibby1 commented 2 years ago

Yeah, I did wonder if this was having an impact -- I've messed around with the library size parameters and simulating more genes, and you get a similar result though. The DE factors look like they're pretty normal e.g. using this data from above:

rowData(sim(*I just selected a few here*) %>%
  select(Gene, DEFacGroup1, DEFacGroup2) %>%
  pivot_longer(cols = DEFacGroup1:DEFacGroup2, names_to = "group", values_to = "de_fac") %>%
  ggplot(aes(group, de_fac)) +
  geom_line(aes(group = Gene), alpha = 0.4, col = "gray60") +
  geom_point(shape = 21, aes(fill = group), stroke = 0.2, size = 2.5) +
  labs(title = "de.prob = 0.9") +
  theme(panel.background = element_blank(),
        panel.border = element_rect(fill = NA),
        axis.title.x = element_blank(),
        legend.position = "none")

image

If you choose the top 10 genes from Group1 in the de.prob = 0.9 condition:

top_genes <- mks$`0.9` %>%
  head(10) %>%
  pull(gene)

VlnPlot(de_data$`0.9`, features = top_genes, split.by = "group", pt.size = 0, ncol = 5)

image

And when you look at the DE factors for these genes, they look like they're typically genes with small differences in DE factors:

rowData(sim$`0.9`) %>%
  data.frame() %>%
  filter(Gene %in% top_genes)

           Gene BaseGeneMean OutlierFactor GeneMean DEFacGroup1 DEFacGroup2
Gene23   Gene23     1.729034             1 1.729034   0.9780493           1
Gene24   Gene24     9.057060             1 9.057060   1.0000000           1
Gene38   Gene38     7.922300             1 7.922300   0.9246081           1
Gene45   Gene45     4.716072             1 4.716072   1.0000000           1
Gene83   Gene83     6.210718             1 6.210718   0.9777275           1
Gene128 Gene128     3.720723             1 3.720723   1.0000000           1
Gene160 Gene160     9.957782             1 9.957782   0.9988495           1
Gene171 Gene171     5.169537             1 5.169537   0.9746705           1
Gene174 Gene174     4.068582             1 4.068582   0.9983049           1
Gene198 Gene198     9.840810             1 9.840810   0.9106077           1

The final goal is to simulate increasing differential expression of a single pathway (200 genes) within a whole dataset (~17k genes x 1k cells), but I can't see a straight forward way after reading the splatter pages. Unsure if you can recommend a better way of doing this with splatter?

lazappi commented 2 years ago

The DE factors all seem to be in the correct direction which is a relief. I think that means there probably isn't a bug and this is just due to random sampling. That makes sense with the unexpected DE genes being cases where the DE factor is almost 1 anyway (although I'm not really sure why this only happens with high values of de.prob...).

The splat simulation doesn't have any concept of a gene network so trying to have a differentially expressed pathway isn't really something it's designed for. If you can explain in more detail what you want to simulate and what you want to use it for I might be able to suggest something.

jackbibby1 commented 2 years ago

Yeah, it's strange that it's just happening at the higher de.prob values.

I'm trying to simulate different types of pathway perturbations for benchmarking of a single cell pathway analysis tool we've developed. Ideally, it would be good to simulate a pathway (~200 "genes") with varying parameters (de.prob, de.facLoc, de.facScale etc.) across two groups, as measures of sensitivity/accuracy etc. Given that some of the pathway analysis tools I'm comparing rely on ranking genes, the permuted pathway would need to be embedded in a broader expression matrix (~17k genes), which can just be held constant across the comparisons. So the final goal is a collection of datasets with 17,200 genes x 1000 cells with two groups, where the groups vary increasingly in their DE parameters in just 200 genes. Would appreciate any suggestions

lazappi commented 2 years ago

First I think I can confirm that the apparently down-regulated genes are due to randomness. Here is what 100 runs with de.prob = 0.5 (which is still pretty high) looks like:

library(Seurat)
library(splatter)
library(tidyverse)

params <- newSplatParams(
    nGenes      = 200, 
    batchCells  = 1000,
    group.prob  = c(0.5, 0.5),
    de.prob     = c(0.5, 0),
    de.downProb = c(1, 0),
    de.facLoc   = 0.3
)

sims <- lapply(1:100, function(rep) {
    splatSimulateGroups(params, seed = rep)
})

markers <- lapply(sims, function(sim) {
    seurat <- CreateSeuratObject(counts(sim)) %>%
        NormalizeData()
    seurat$Group <- sim$Group
    Idents(seurat) <- "Group"
    FindAllMarkers(seurat, only.pos = T)
})

markers_summ <- purrr::map_dfr(seq_along(markers), function(rep) {
    markers[[rep]] %>%
        filter(
            p_val_adj < 0.05,
            avg_log2FC > 0.4
        ) %>%
        group_by(cluster) %>%
        count() %>%
        mutate(Rep = rep) %>%
        relocate(Rep)
}) %>%
    mutate(n_dir = if_else(cluster == "Group1", -n, n))

ggplot(markers_summ, aes(x = Rep, y = n_dir, group = cluster, fill = cluster)) +
    geom_col(col = "black", lwd = 0.3) +
    labs(y = "Number of DE genes per group", x = "Replicate") +
    scale_fill_manual(
        values = c("tomato", "cornflowerblue"),
        name = "Group"
    ) +
    theme(
        panel.background = element_blank(),
        panel.border     = element_rect(fill = NA)
    )

image

You can see that there are a few replicates where this happens. I think it's just almost guaranteed to happen if de.prob is high enough.

For your use case I wonder if it is better to adjust de.facLoc and de.facScale rather than de.prob? This would be something like saying the pathway is always differentially regulated but the size of the effect changes. One thing to keep in find is that two splat simulations are independent (i.e. Gene1 in one simulation has no relationship to Gene2 in another). I also wonder if you want only up-regulation? In a real gene network sometimes down-regulation of one part leads to up-regulation of another (if there is a repressor for example).

jackbibby1 commented 2 years ago

Hey. Thanks for having a look into it. I also ended up generating some de factors outside of splatter, and got similar results too, so that would agree the effect is due to the random sampling.

Yup, I'm hoping to use both de.prob and de.facLoc/Scale in the end to see the effect of number of de genes, and magnitude, so I'll keep having a play around with it to see what works well. RE the upregulated vs down regulated, we're looking at different distributions of pathway activity -- uni/bidirectional, variance etc., to try and cover most reasonable distributions of gene networks, and see how well different tools perform.

Anyway, thanks again for the help with this. I'll close the issue for now