volsa
commented
1 month ago
volsa
commented
1 month ago Some quick and dirty benchmarks in which I made index look-ups case-sensitive, indicating removing the to_lowercase()s could improve the performance. See also https://github.com/PLC-lang/rusty/compare/master...case-sensitive-index-lookup
Master Branch
~/Development/rusty on master [$?] is 📦 v0.2.0 via 🦀 v1.77.1
➜ ./profile.sh
Finished release [optimized] target(s) in 0.07s
Benchmark 1: ./target/release/plc check ~/Desktop/internal-project/conf/plc.json --error-config=internal-project-profile.json --threads=1
Time (mean ± σ): 4.340 s ± 0.039 s [User: 4.064 s, System: 0.274 s]
Range (min … max): 4.295 s … 4.411 s 10 runs
Benchmark 2: ./target/release/plc check ~/Desktop/internal-project/conf/plc.json --error-config=internal-project-profile.json --threads=2
Time (mean ± σ): 2.906 s ± 0.049 s [User: 4.135 s, System: 0.278 s]
Range (min … max): 2.835 s … 2.973 s 10 runs
Benchmark 3: ./target/release/plc check ~/Desktop/internal-project/conf/plc.json --error-config=internal-project-profile.json --threads=4
Time (mean ± σ): 2.110 s ± 0.018 s [User: 4.108 s, System: 0.286 s]
Range (min … max): 2.087 s … 2.143 s 10 runs
Benchmark 4: ./target/release/plc check ~/Desktop/internal-project/conf/plc.json --error-config=internal-project-profile.json --threads=8
Time (mean ± σ): 1.775 s ± 0.025 s [User: 4.222 s, System: 0.328 s]
Range (min … max): 1.745 s … 1.816 s 10 runs
Summary
./target/release/plc check ~/Desktop/internal-project/conf/plc.json --error-config=internal-project-profile.json --threads=8 ran
1.19 ± 0.02 times faster than ./target/release/plc check ~/Desktop/internal-project/conf/plc.json --error-config=internal-project-profile.json --threads=4
1.64 ± 0.04 times faster than ./target/release/plc check ~/Desktop/internal-project/conf/plc.json --error-config=internal-project-profile.json --threads=2
2.45 ± 0.04 times faster than ./target/release/plc check ~/Desktop/internal-project/conf/plc.json --error-config=internal-project-profile.json --threads=1Case Sensitive Branch
~/Development/rusty on master [$!?] is 📦 v0.2.0 via 🦀 v1.77.1
➜ ./profile.sh
Finished release [optimized] target(s) in 0.07s
Benchmark 1: ./target/release/plc check ~/Desktop/internal-project/conf/plc.json --error-config=internal-project-profile.json --threads=1
Time (mean ± σ): 3.035 s ± 0.060 s [User: 2.736 s, System: 0.292 s]
Range (min … max): 2.956 s … 3.133 s 10 runs
Benchmark 2: ./target/release/plc check ~/Desktop/internal-project/conf/plc.json --error-config=internal-project-profile.json --threads=2
Time (mean ± σ): 2.051 s ± 0.022 s [User: 2.765 s, System: 0.261 s]
Range (min … max): 2.027 s … 2.105 s 10 runs
Benchmark 3: ./target/release/plc check ~/Desktop/internal-project/conf/plc.json --error-config=internal-project-profile.json --threads=4
Time (mean ± σ): 1.569 s ± 0.021 s [User: 2.769 s, System: 0.293 s]
Range (min … max): 1.538 s … 1.593 s 10 runs
Benchmark 4: ./target/release/plc check ~/Desktop/internal-project/conf/plc.json --error-config=internal-project-profile.json --threads=8
Time (mean ± σ): 1.337 s ± 0.017 s [User: 2.842 s, System: 0.311 s]
Range (min … max): 1.319 s … 1.374 s 10 runs
Summary
./target/release/plc check ~/Desktop/internal-project/conf/plc.json --error-config=internal-project-profile.json --threads=8 ran
1.17 ± 0.02 times faster than ./target/release/plc check ~/Desktop/internal-project/conf/plc.json --error-config=internal-project-profile.json --threads=4
1.53 ± 0.02 times faster than ./target/release/plc check ~/Desktop/internal-project/conf/plc.json --error-config=internal-project-profile.json --threads=2
2.27 ± 0.05 times faster than ./target/release/plc check ~/Desktop/internal-project/conf/plc.json --error-config=internal-project-profile.json --threads=1 riederm
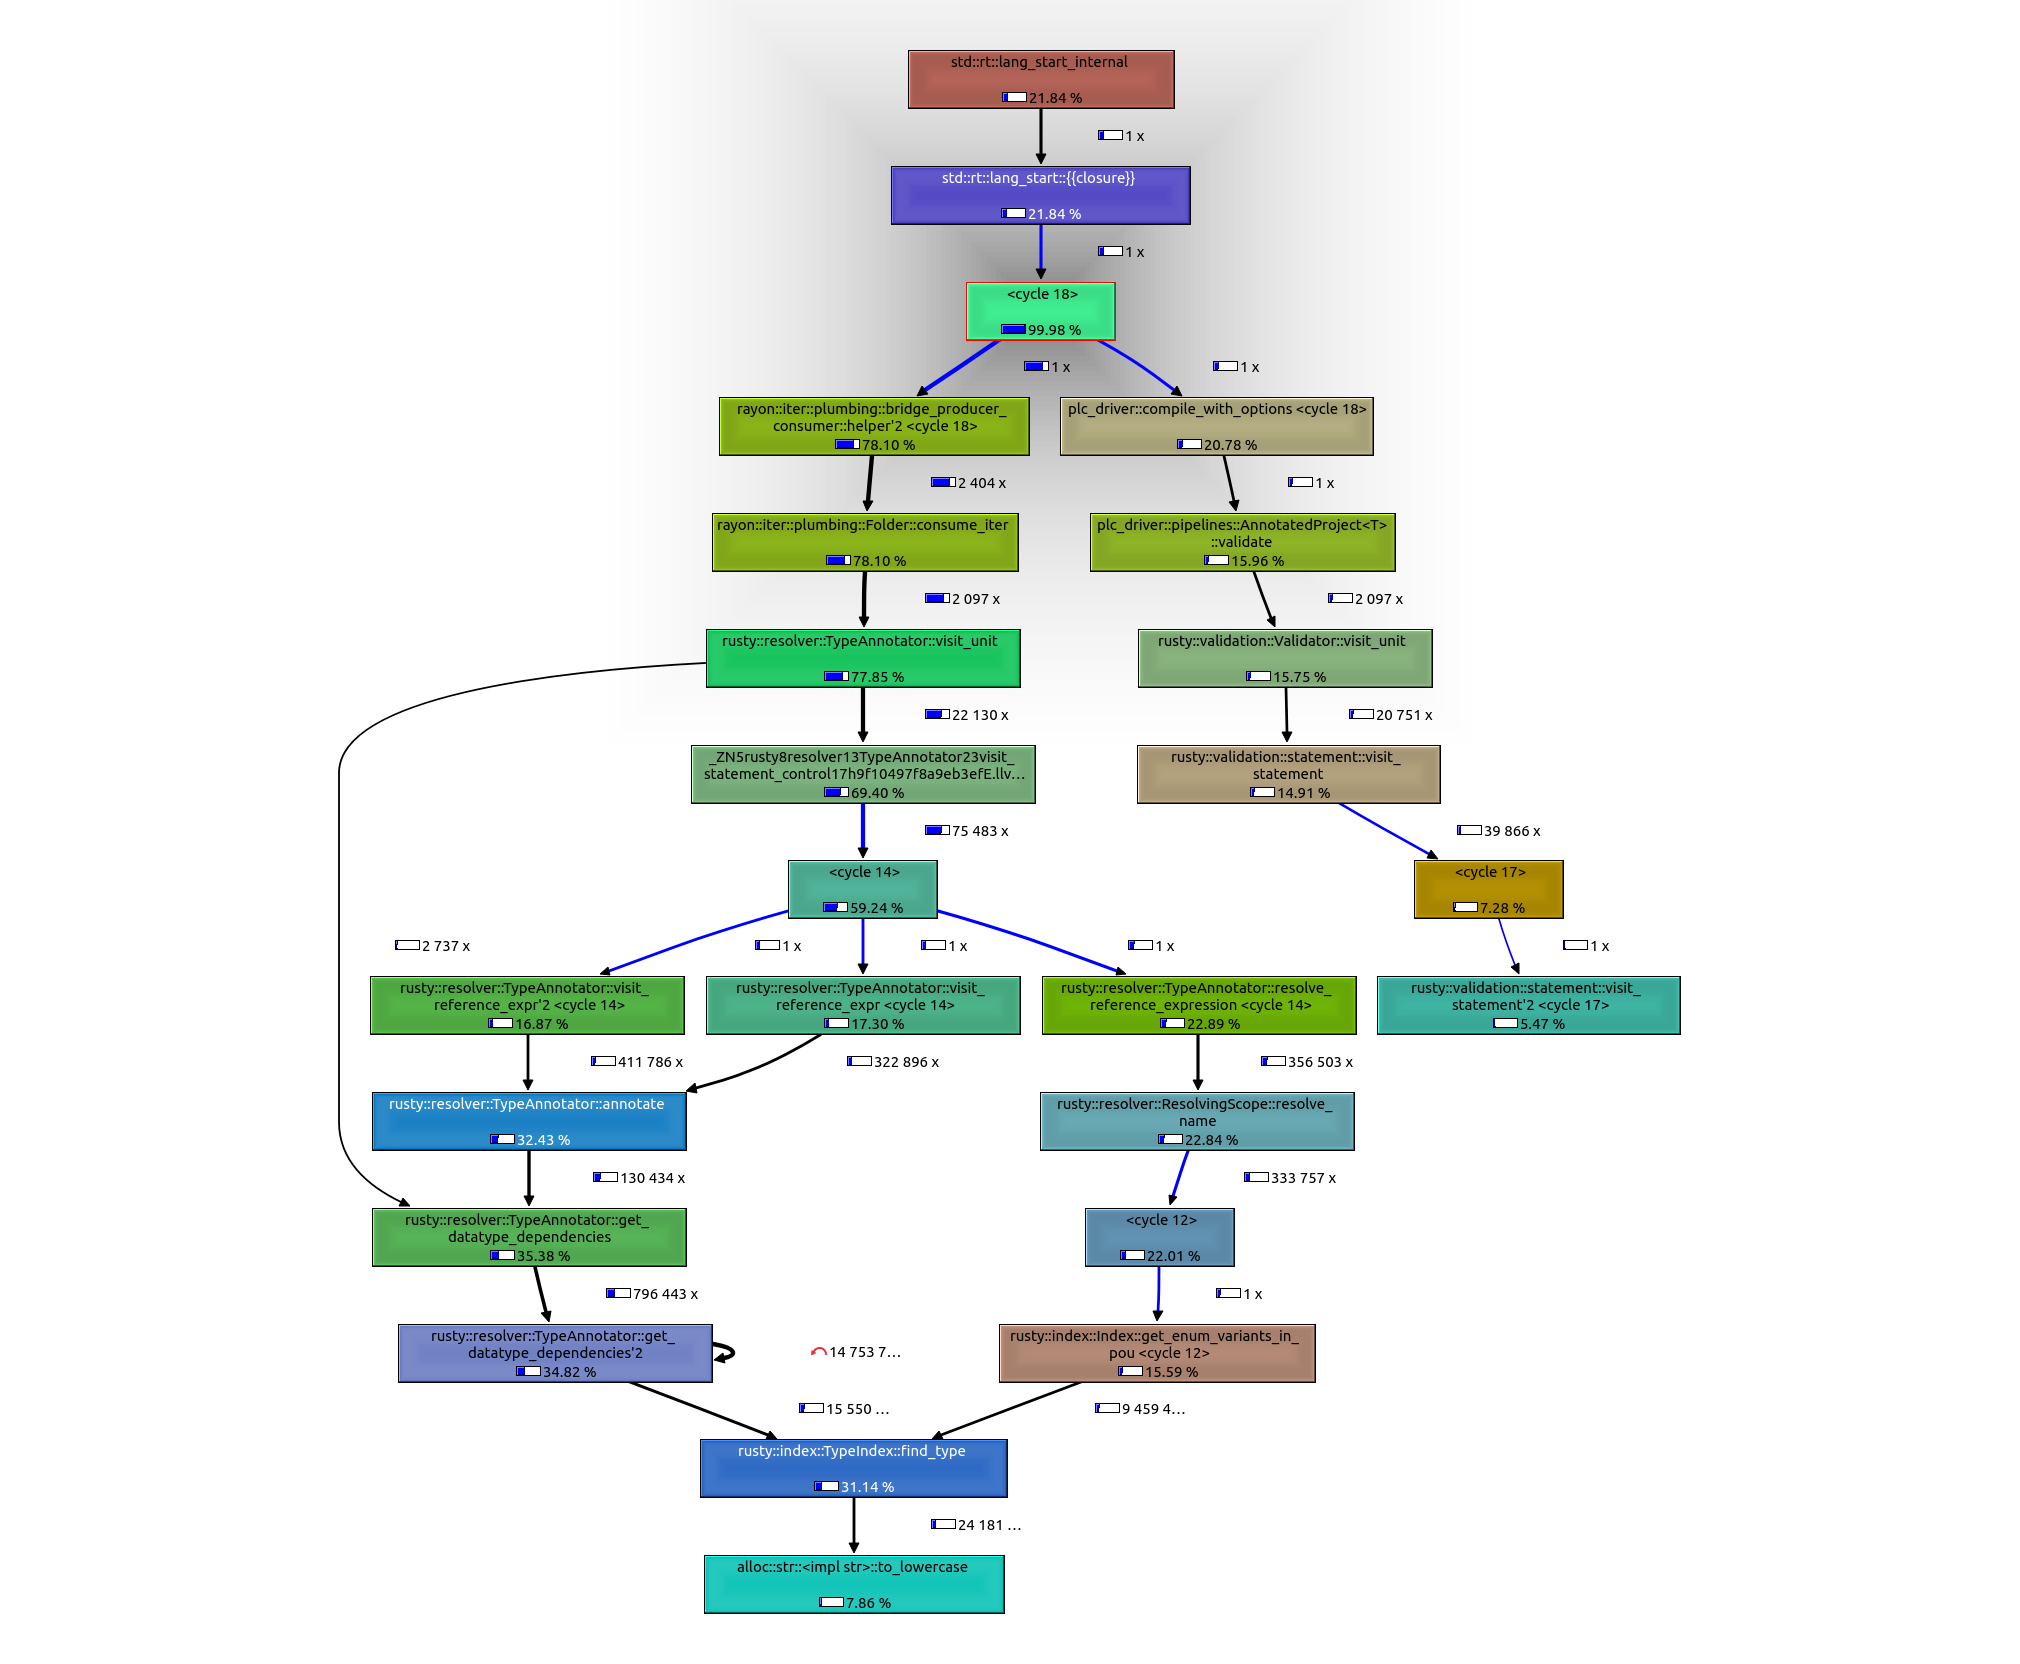
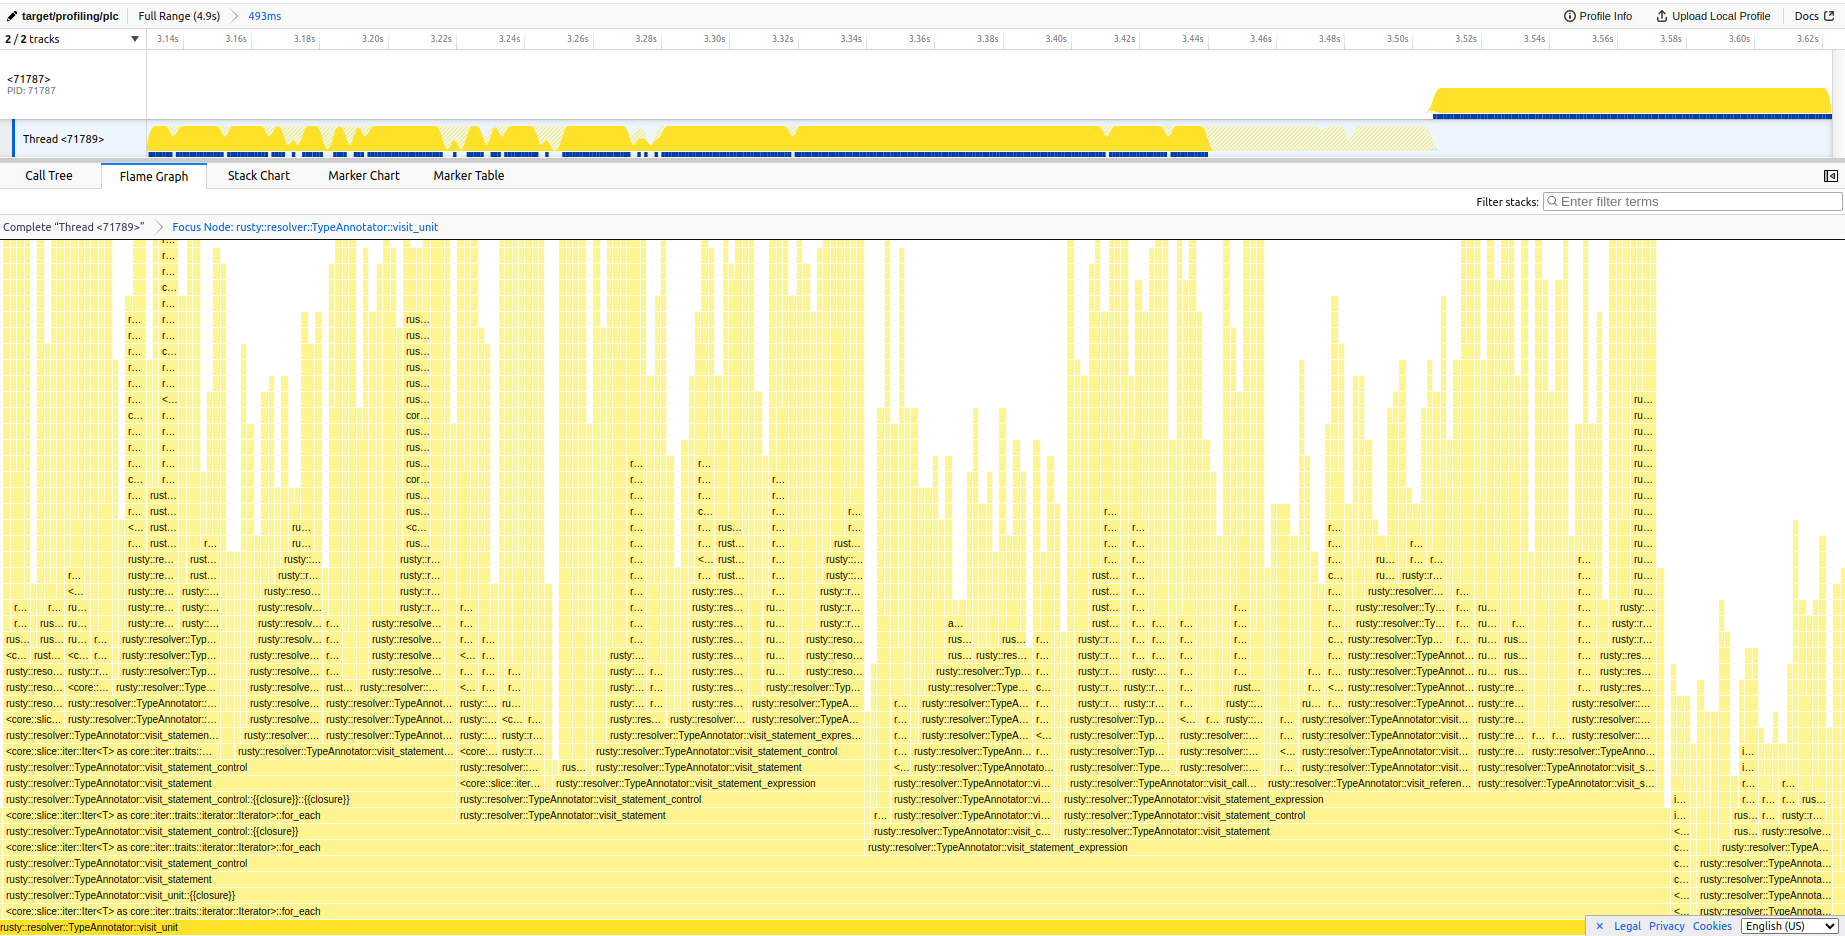
Related to https://github.com/PLC-lang/rusty/issues/1185, we did some further investigations into potential resolver performance improvments and realized that there are no obvious bottlenecks per-se (at least the flamegraph didn't show any) but rather looking at the call-graph the
to_lowercase()method becomes suspicious (which is called around ~24 million times in an internal project according to callgrind).Specifically the
find_type(and many other index methods) callto_lowercase()before looking up strings in a HashMap. It might be interesting to see if removing allto_lowercase()calls for look-ups improves theplc checkperformance. If it does, we may be able to improve the performance by implementing some tweaks into the index while keeping the compiler case-sensitive (because the norm defines it as such). Some of these tweaks may be:find_type("MyType")is called twice, the first call will cache the result whereas the second call will check if there's a cache-entry (theto_lowercase()method will thereby only be called in the first look-up)make_ascii_lowercasemethod which looks interesting because of in-place modificationsFor what it's worth here's the call graph and flame-graph (note the somewhat narrow spikes in the flamegraph, indicating no real bottlenecks are present)